Is Skinny Fat Dangerous? At a Normal Weight, a Large Waist Went With More Deaths. The Study That Best Fits the ‘Three-Fold’ Claim Found 1.9.

“The Cornell ‘Skinny Fat’ Study: Tracking Invisible Visceral Fat Over 13 Years.” That is a chapter heading in a video posted on 17 June 2026 by a physician-author’s food-and-health channel, watched 1,803,515 times by 10 October [1]. A sister video’s description, 710,455 views, puts the claim in one line: “Women with extra body fat over 13 years have a three-fold higher risk of breast cancer”, and “visceral fat is the real culprit behind 14 other cancers” [1]. A 59-second clip on the same channel is titled “LOSE THIS TO DECREASE YOUR RISK OF CANCER BY 3X” [1].
Search for “skinny fat”, which 60,500 people a month do (from a paid keyword database, pulled 10 October 2026), and you get a different conversation [2]. The results are mostly gym videos about whether to bulk or cut, and the questions people ask next are about the mirror: how do I get rid of it, why am I still skinny fat after working out [2]. Both conversations rest on the same idea: that you can look slim, weigh a normal amount and still carry enough fat to matter. Does it matter? And if it does, is it anything like three times?
What is skinny fat?
A normal weight for your height with a lot of fat on board. Researchers call it normal weight obesity: a body mass index (BMI, weight scaled for height) in the normal band, usually 18.5 to 24.9, with a body-fat percentage that would count as high [3]. A close cousin, normal-weight central obesity, swaps the body-fat reading for a tape measure: a normal BMI with a large waist [6] [11]. Neither is a medical diagnosis, and there is no agreed line for “too much” [2] [3]. A 2010 study, which this page leans on throughout, simply called the fattest third of normal-weight American adults normal weight obesity: above 23.1% body fat for men and 33.3% for women [3]. Other studies draw the line elsewhere, and one Korean trial counted only a BMI of 18.5 to 22.9 as normal [28].
How common is it? That depends entirely on the line. By its own definition the 2010 study’s group was a third of normal-weight Americans, which its authors put at about 30 million people [3]. Across 91 countries, 21.7% of adults with a normal BMI had a waist of at least 31.5 in (80 cm) for women or 37.0 in (94 cm) for men [5]. With the stricter American line, over 34.6 in (88 cm), only 2.6% of normal-weight older American women qualified [6]. The underlying point is not in dispute: BMI is a blunt tool. Pooled across 32 groups of people, the usual BMI cut-offs missed half of those whom a body-fat measurement flagged as carrying too much fat [4].
Is skinny fat a health risk?
Yes, on the balance of the evidence, and how big a risk depends on where the fat is. People of normal weight who carry more fat have worse blood pressure, blood fats and blood sugar, consistently [5] [7]. In three large studies of deaths at a normal BMI that measured the waist, a large waist went with a higher death rate from all causes [6] [11] [12]. A high body-fat percentage at a normal BMI, measured by a scan or an electrical reading, tracked deaths less consistently. An analysis of 168,099 people in two large cohorts, one American and one British, found more deaths from heart disease, stroke and diabetes in both [33]; a 2026 analysis of the same British cohort found more deaths from heart and blood-vessel disease, and from all causes, only in people who also had more than two of six warning signs in their blood tests and blood pressure [34]; and a 2010 study of 6,171 American adults found no rise in deaths from all causes [3]. That is the claim this page rates, and it rates Supported.
A word on the numbers before there are more of them. Most of the figures on this page are hazard ratios: how often something happened in one group compared with another over the same stretch of time. A hazard ratio of 1.00 means no difference; 1.50 means half as often again; 2.00 means twice as often. They compare groups, and they are not a forecast for any one person. When a study gives a range beside one, that is the range the true figure for the group probably sits in. It is not the range of what could happen to you.
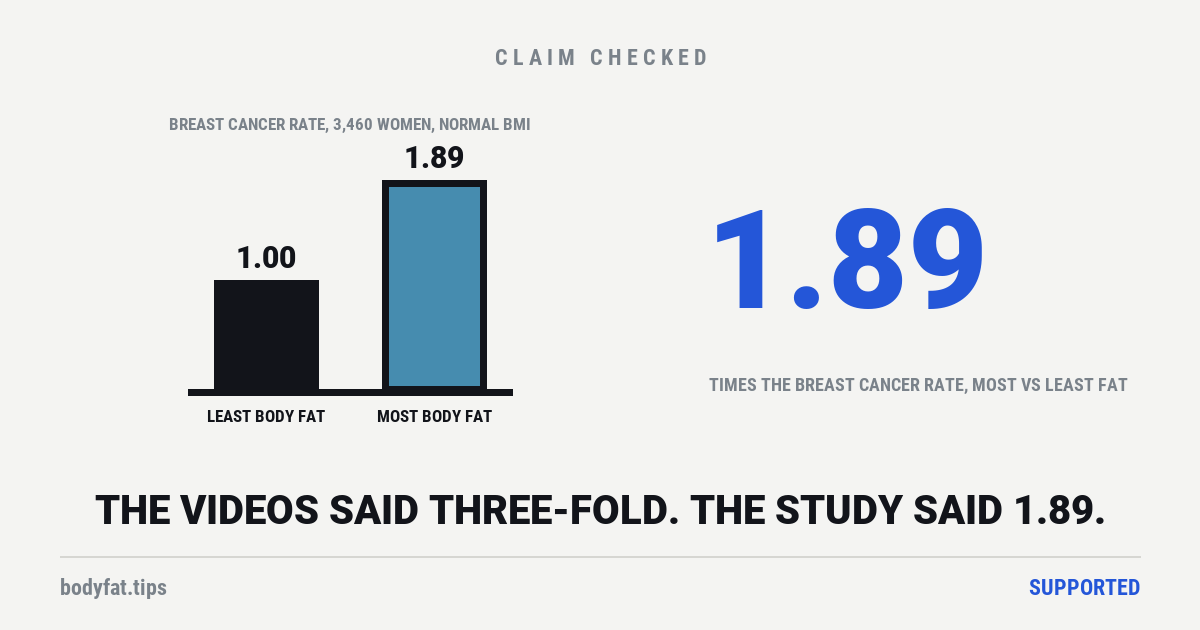
The videos’ “three-fold”: not found. The breast cancer study that best fits the description, which had a Cornell corresponding author, found 1.89 times the rate in the women with the most body fat against those with the least, over a median 16 years, not 13 [14]. We could not find three-fold in it or in four other studies of body fat and breast cancer [15] [16] [17] [19].
These are also all observational studies: they watched people and counted what happened. None of them can prove that the fat itself caused the extra illness. Women with a large waist at a normal weight were, for example, less active and more often smokers [6], and the studies allow for that only as well as they measured it.
Is skinny fat bad for your heart and blood sugar?
The consistent part. A 2022 pooling of studies covering 177,792 people found that those with normal weight obesity had higher odds (roughly, how much more often a group has a condition; 1.00 means no difference) of nearly every heart and metabolic risk factor measured: 1.92 for metabolic syndrome, the cluster of high blood pressure, high blood sugar, abnormal blood fats and a large waist; 1.40 for high blood pressure; 1.39 for diabetes [7]. Read the pooled total before trusting its size, though. About two-thirds of those people, 117,163, came from a single Japanese study, which defined normal weight obesity by waist-to-height ratio rather than by body fat [7]. And these are studies of risk factors, not of heart attacks or deaths.
A survey of 471,228 adults in 91 countries, which measured waists, found the same pattern for the tape-measure version: at a normal BMI, a large waist went with 1.81 times the odds of diabetes and 1.29 times the odds of high blood pressure [5]. That survey looked at people once, so it cannot say which came first.
Does skinny fat shorten your life?
Here the answer splits, and the split is the most useful thing on this page.
Measured as a body-fat percentage, the evidence is less consistent. The 2010 study followed 6,171 normal-weight American adults, average age 41, for about nine years, with body fat estimated by bioimpedance (a weak electrical current sent through the body, the technology in bathroom body-fat scales) [3]. The fattest third had four times the rate of metabolic syndrome, 16.6% against 4.8% [3]. But they did not die sooner. Against the leanest third, the death rate from all causes was 0.90 times for men and 1.06 for women, both indistinguishable from no difference [3]. Heart deaths were higher in women, 2.2 times after the researchers’ adjustments, with a range for the group running from barely raised (1.03) to more than four times (4.67), because it rested on few deaths; in men they were not clearly raised [3]. In that study, waist size was not tied to deaths from all causes either [3].
The same research group then looked at 1,528 people aged 60 and over. The paper’s summary calls normal weight obesity “a risk for cardiovascular mortality” [8], and the university’s news release reports “no difference in overall mortality”, with heart deaths higher in the short term for women and “about four times higher” over the long term for men [9]. We could not read the paper itself to check those figures [8]. A 2025 paper by another team describes the same study as finding no link with deaths from heart disease and related causes [33]. A 2026 study used whole-body X-ray scans (DXA, the reference method) on 6,424 normal-weight American adults aged 20 to 65 and reports that more body fat went with a higher death rate [10]. We read its summary and its open figures, which show 112 deaths in all; the size of the effect is in the part behind the paywall [10].
Two larger studies do not settle it. One analysed 168,099 adults with a normal BMI: 8,152 in the US national health survey, their body fat measured by DXA, and 159,947 in the UK Biobank, a large British health study, measured by an electrical reading [33]. Over about 12 years, those with a high body-fat percentage (25% or more for men, 35% or more for women) died of heart disease, stroke, high blood pressure or diabetes at 1.45 times the rate of the others in the American group and 1.22 times in the British one [33]. It did not report deaths from all causes, and it allowed for age, sex, race, smoking, drinking, physical activity, education and income, but not for blood pressure, blood sugar or blood fats [33]. The other, published in 2026, took 121,586 people in the UK Biobank, of normal weight and heavier, and split the normal-weight people with high body fat by how many of six other warning signs they had, among them high blood pressure, blood sugar and blood fats [34]. Against normal-weight people with normal body fat and few warning signs, those with more than two had 1.29 times the odds of dying of any cause, and those with two or fewer showed no clear difference [34]. Deaths from heart and blood-vessel disease, strokes among them, followed the same pattern: 1.86 times the odds with more than two warning signs, and no clear difference with two or fewer (we read its summary only) [34]. Both drew on the same cohort, the UK Biobank, so in Britain they are one cohort analysed twice, not two confirmations, and the second split it by the warning signs the first did not allow for; that observation is ours, from the cohort each paper names [33] [34].
Measured at the waist, the evidence is more consistent. In 15,184 American adults followed for about 14 years, a man with a normal BMI of 22 and a waist-to-hip ratio of 1.00 (waist as wide as hips) had 1.87 times the death rate of a man with the same BMI and a ratio of 0.89; for women, 1.48 times, comparing ratios of 0.92 and 0.80 [11]. Those are comparisons the researchers’ model made between typical profiles; in the data, only 11.0% of normal-BMI men and 3.3% of normal-BMI women had a ratio above 1.0 [11]. Among 156,624 American women past menopause, those of normal weight with a waist over 34.6 in (88 cm) died at 1.31 times the rate of normal-weight women with smaller waists, with raised heart deaths (1.25) and cancer deaths (1.20) [6]. And a pooling of 11 studies and 650,386 white adults found each extra 2 inches (5 cm) of waist went with a 7% higher death rate in men and 9% in women, at every BMI from 20 to 50, the normal range included [12]. In that pooling the waists were mostly measured by the participants themselves, and the largest single study held 217,428 people [12].
In China the pattern was the same for heart disease and strokes. Among 308,071 adults followed for about ten years, normal weight with a large waist went with 1.27 times the rate of major heart and blood-vessel events, and normal weight with high body fat 1.11 times (we read the summary only, which does not give the study’s normal BMI range) [13].
| Who was studied | How the fat was measured | What was counted | What was found |
|---|---|---|---|
| 6,171 US adults, average age 41 [3] | Electrical body-fat reading; fattest third | Deaths, about 9 years | All deaths: not higher, men or women, nor with a large waist. Heart deaths: higher in women, not men |
| 1,528 US adults aged 60 and over [8] [9] | Electrical body-fat reading | Deaths, about 13 years | All deaths: no difference. Heart deaths: raised (we read the summary only) |
| 6,424 US adults aged 20 to 65 [10] | Whole-body X-ray scan (DXA) | Deaths, to 2019 | More body fat went with a higher death rate; 112 deaths in all |
| 168,099 US and UK adults [33] | Whole-body X-ray scan (DXA) in the US; electrical body-fat reading in the UK | Deaths from heart disease, stroke, high blood pressure and diabetes, about 12 years | US 1.45 times, UK 1.22 times |
| 121,586 UK adults, of normal weight and heavier [34] | Body-fat percentage (the summary does not say how it was measured) | Deaths from all causes, and from heart and blood-vessel disease | All deaths: 1.29 times the odds; heart and blood-vessel deaths: 1.86 times; both only with more than two other warning signs (we read the summary only) |
| 15,184 US adults aged 18 to 90, 6,062 of them at a normal BMI [11] | Waist-to-hip ratio | Deaths, about 14 years | Men 1.87 times, women 1.48 times, against the same BMI with a lower ratio |
| 156,624 US women past menopause, 54,125 of them at a normal weight [6] | Waist over 34.6 in (88 cm) | Deaths, up to 2017 | 1.31 times; only 2.6% of the normal-weight women had the large waist |
| 650,386 white adults in 11 studies, of every BMI from 15 to 50 [12] | Waist, mostly measured at home | Deaths, about 9 years | A bigger waist went with more deaths at every BMI from 20 up, the normal range included |
| 308,071 Chinese adults [13] | Waist; electrical body-fat reading | Major heart and blood-vessel events, about 10 years | Large waist 1.27 times; high body fat 1.11 times |
| 3,460 US women past menopause [14] | Whole-body X-ray scan (DXA) | Breast cancer, about 16 years | Most fat against least: 1.89 times |
| 149,928 UK adults aged 40 to 70 [16] | Electrical body-fat reading; waist | Four cancers, about 7 years | Breast and womb: higher. Colon: higher in men only. Ovary: no link |
| 319,781 Chinese adults [18] | Electrical body-fat reading; fattest third | Liver cancer, about 12 years | 1.22 times |
| Children and teenagers | — | — | Not in this table: none of these studies followed them |
Does skinny fat raise cancer risk? The “three-fold” checked
The study that best fits the videos. In 2019 a team whose corresponding author was at Weill Cornell Medicine published an analysis of 3,460 women past menopause, all with a normal BMI, from the Women’s Health Initiative, a long-running US study of older women [14]. Their body fat was measured by DXA, and over a median 16 years, 182 developed invasive breast cancer [14]. The quarter with the most body fat, more than 55.3 lb (25.1 kg) of it, had 1.89 times the breast cancer rate of the quarter with the least, 41.2 lb (18.7 kg) or less; for the commonest, hormone-sensitive kind it was 2.21 times [14]. In plain numbers, by our arithmetic from the paper’s own counts, that is about 4.4 cancers per 1,000 women a year in the fattest quarter against 2.5 in the leanest, before the researchers’ adjustments [14]. The link held after allowing for BMI [14].
So the core of the claim stands up: at a normal BMI, more body fat went with more breast cancer. Now the details. Three-fold: none of the study’s estimates reaches three [14]. 13 years: the women were followed a median 16 years [14]. An earlier analysis of the same women’s scans, published in 2013, did follow them a median 12.9 years, but it covered 10,960 women of every weight, not only normal weight, and the fattest fifth by trunk fat had 2.05 times the rate of the leanest; its largest figure anywhere, for one fat-distribution ratio in a subgroup, was 2.55 [15]. In that study, a plain BMI (1.97 times) and a tape-measure waist (1.97 times) predicted breast cancer about as well as the scans did [15]. Visceral: the 2019 analysis measured trunk fat, everything stored around the torso, not visceral fat, the fat packed around the organs [14].
Other studies at a normal BMI point the same way, and smaller. Among 149,928 normal-weight adults in the UK Biobank, a large British health study, followed for about seven years, women past menopause with the most fat had 1.32 to 1.56 times the breast cancer rate, depending on the measure, and the highest of those figures belonged to plain BMI, even inside the normal range [16]. Fat around the trunk went with 1.72 times the rate of womb cancer, some fat measures with colon cancer in men, and none with ovarian cancer or with bowel cancer in women [16]. In 319,781 Chinese adults of normal weight, the fattest third had 1.22 times the rate of liver cancer [18].
A 2025 study added its own UK Biobank figure, 1.19 times for women past menopause with normal weight obesity, and pooled it with two others to conclude that every 5 points of body fat went with 15% more breast cancer after menopause at a normal BMI [17]. Look at what was pooled. The three analyses were its own, the 2019 American study, and the 2021 UK Biobank study above, which is to say the same British women twice [16] [17]. It is not three independent groups of people. That observation is ours; the paper does not discuss it.
“Visceral fat is the real culprit.” Visceral fat does track cancer. In the whole UK Biobank, 461,665 adults of every weight, visceral fat estimated from body measurements went with 1.23 times the cancer rate in men and 1.27 in women, comparing a person at the 90th percentile with one at the 10th [20]. Allowing for BMI, those figures fell to 1.17 and 1.12; allowing for the waist instead, to 1.02 and 1.04, which could be no difference at all [20]. For some single cancers the link held after allowing for the waist, among them breast cancer after menopause and womb cancer in women and kidney cancer in men [20]. But “the real culprit” means more than tracking, and at a normal weight the evidence does not single it out. When the Women’s Health Initiative scans were analysed again to separate the two kinds of belly fat, normal-weight women had 1.48 times the breast cancer rate for every 100 square centimetres (about 15.5 square inches) of visceral fat and 1.32 times for the same area of fat under the skin; at normal weight the two rose and fell together closely, which makes them hard to tell apart [19].
“14 other cancers.” The best-known list of cancers tied to body fat is the International Agency for Research on Cancer’s. In 2016 its working group found sufficient evidence that excess body fat raises the risk of 13 cancers, among them the oesophagus, colon and rectum, liver, pancreas, kidney, womb, ovary and breast after menopause [21]. That list was built mostly on BMI, comparing heavier people with people of normal BMI, not on visceral fat [21]. The same group judged that the evidence that losing weight on purpose lowers cancer risk in people “remains to be established” [21]. Alcohol, the other cancer risk most people can change, has its own verdict.
“Lose this to decrease your risk of cancer by 3X.” We found no trial that set out to lower body fat in people of normal weight and counted cancers, heart attacks or deaths [22]. The nearest we found is the Women’s Health Initiative’s diet trial, which put 48,835 women past menopause, of every weight, on a low-fat diet or left them on their usual one [39]. In the women it scanned, the diet took off about 2.4 lb (1.1 kg) more fat than usual eating did, and the biggest drop in body-fat percentage was in the normal-weight women [38]. Over about eight years, the rate of invasive breast cancer in the diet group was 0.91 times the other group’s, a difference that could be chance; among the quarter of women with the lowest BMI, under 24.9, it was 0.89 times, which could be chance too [39].
Followed for longer, what gap there was closed. Over about 12 years the diet group’s breast cancer rate was 0.97 times the other group’s, a difference that could be chance, and the trial’s authors report, without showing the figures, that a woman’s BMI did not change the result [40]. After nearly 20 years, the diet group’s death rate from breast cancer was 0.79 times the other group’s, a fall probably not down to chance [42]. But splitting the women at a BMI of 30, the trial’s authors saw little sign of any effect on the outcomes they counted among those under it, and the falls they did see showed mainly in women with obesity, though their tests of that difference were mostly not significant [41]. The one fall near threefold came in another analysis of the same trial: among 4,246 women with three or four warning signs (a large waist, high blood pressure, high cholesterol or diabetes), whose median BMI was about 33, in the obese range, deaths from breast cancer in the diet group ran at 0.31 times the rate, on 42 deaths in all (our sum of the paper’s counts) [43]. Its authors say the finding “should be considered hypothesis-generating”, a lead to test rather than a result; allowing for the women’s weight and their weight change left it at 0.30, so weight lost did not explain it; and among women with a BMI under 25 the figure was 0.81, a difference that could be chance [43]. In heavier adults, a trial of weight loss in 4,859 people with type 2 diabetes counted cancers for a median 11 years and found 0.93 times the rate in the weight-loss group, again a difference that could be chance [35]. The studies above show that more fat goes with more cancer. None of these trials shows taking fat off cutting cancer by anything near three times.
If the 2010 study found no extra deaths, why does skinny fat keep turning up as a risk?
This section is the desk’s own reasoning, and it is labelled as such. The 2010 study of normal weight obesity found more metabolic syndrome but no more deaths [3]. Later studies found more deaths with a large waist, more deaths from heart disease and stroke with more body fat in one large analysis, and more breast cancer with more body fat [6] [11] [14] [33]. If the fat matters, why did the 2010 study not find more deaths? Three answers, with the evidence for each.
Answer one: it is where the fat sits. Line up the studies we read that counted deaths at a normal BMI. The three built around the waist, two American cohorts and a pooling of 11, each found a higher death rate from all causes [6] [11] [12]. In China a large waist carried more risk of heart disease and stroke than a high body-fat reading did, 1.27 against 1.11 [13]. The studies of body-fat percentage agree less, whichever deaths are counted. For deaths from heart disease, stroke and diabetes, one 2025 analysis found a rise in both its cohorts [33], the 2010 study in women only [3], the study of older adults is described both ways [8] [33], and a 2026 analysis of the same British cohort as the 2025 one found it only in people with other warning signs [34]. For deaths from all causes they found no rise, a rise, or a rise only with other warning signs [3] [8] [10] [34]. The 2025 analysis did not count deaths from all causes, so it cannot show the two kinds of death parting [33]. The waist does not win every time: in the 2010 study’s 6,171 people it was not tied to deaths either [3]. Each study is measured. Reading them side by side is ours, and they differ in more than the yardstick: in their size, years, ages and countries.
Answer two: some of it is the top end of “normal”. The normal-weight people with the most fat were not the skinny ones. In the 2010 study their average BMI was 23.5, against 21.8 for the leanest men and 20.7 for the leanest women [3]. In a 2017 study of breast tissue from 72 normal-weight women, those with inflamed breast fat had a median BMI of 23.0 against 21.8 [32]. And in the UK Biobank, plain BMI inside the normal range tracked breast cancer as strongly as any body-fat measure [16]. This is measured, and it is not the whole story: in the 2019 study the link held after allowing for BMI [14].
Answer three: some of it is missing muscle. “Skinny fat” describes two things, too much fat and too little muscle, and the second has its own record. In the 2010 study, the normal-weight men with the most fat carried less lean mass, 116.8 lb (53.0 kg) against 127.6 lb (57.9 kg) [3]. In 38,006 American men, all health professionals, followed for 21 years, the ones with the least estimated lean mass died at higher rates than men with more, even as more fat also meant more deaths [23]. The pattern is measured. That the missing muscle causes part of the risk is a surmise; the measures of strength that predict death have their own verdict, and the same caution about cause applies there.
Put the three together and here is what we think is true, stated plainly so you can disagree with it: skinny fat is less a hidden kind of obesity than two ordinary risks that a normal BMI can hide, fat around the middle and too little muscle, and a tape measure has tracked deaths from all causes more consistently than a body-fat reading has.
What we could not find, and would like to: a trial that took normal-weight people with a high body-fat reading or a large waist, changed their bodies by training or diet, and followed them long enough to count heart attacks, cancers or deaths [22]. The trials in skinny-fat people that we read, below, ran from 12 weeks to two years and measured body make-up, blood pressure or blood fats, not illness, and the reviews that have pooled such trials since 2024 measured the same kinds of thing [24] [36] [37]. If you know of a longer one, the corrections line on this site is open. A pooled answer for the waist is planned: a review of the cohort studies of a large waist at a normal BMI, deaths and heart events was registered in June 2026, and we found no results from it yet [44].
Who these studies were done on
If you are wondering whether any of this applies to you, the table above is the answer, and it has edges. The death studies are mostly of American and British adults, plus a pooling of 11 cohorts from the US, Sweden and Australia restricted to white adults [3] [6] [11] [12] [33] [34]. The cancer evidence is strongest for women past menopause, from the US and Britain [14] [16] [17]; for men there is one colon-cancer signal and one liver-cancer study [16] [18]. The Chinese liver-cancer study used the same normal BMI band as the American ones, 18.5 to 24.9 [18]. None of the studies on this page that followed people over time included children or teenagers; the 2022 pooling of risk-factor studies included some aged 13 and over [7].
The definitions move too. “High” body fat meant above 23.1% for men and 33.3% for women in one study [3], above 21.8% and 31.2% in another [18], and above 33.3% for women by a different device in a third [17]. A reading from a bathroom scale is a softer number still; our verdict on body fat scales found one reading can sit many points from a scan. This page is journalism, not medical advice: if you are worried about your own numbers, a clinician can measure your waist, blood pressure, blood sugar and blood fats, which is where these studies found the clearest differences.
How can I get rid of skinny fat?
The trials point to building muscle and eating more protein, and to the scale not moving much. Take that with a large caution: the trials in skinny-fat people are few and small. A 2024 review of diet and exercise trials found seven, published from 2012 to 2022, in people with a BMI under 30 and raised body fat [24]. Diets that cut calories took weight off but took lean mass with it, so the body-fat percentage barely changed; more protein did better, and so did high-intensity interval training, in a trial the review judged at high risk of bias [24]. Two later reviews looked at exercise alone. One pooled ten small studies in people with normal weight obesity, 408 people by its summary, though the groups in its own chart of body fat add up to 626 by our count; it judged nine of the ten at high risk of bias because those running them could have known which group each person would join, and it found that three of the four kinds of training it compared lowered the body-fat percentage (we read its summary and its figures) [37]. The other pooled 13 studies of 354 adults whose studies’ average BMI was 27 or under, normal weight or just over it, and found that exercise cut visceral fat, measured by CT, MRI or DXA scans, against no exercise [36]. Two cautions come with it: 86% of the spread between the studies’ results was more than chance would produce, and the before-and-after studies on their own did not cross the line researchers use for “probably not chance”; the review rated the certainty of its evidence low (we read its summary) [36]. It is the nearest thing we found to evidence that exercise can shed visceral fat at or near a normal weight, and it was measured on a scan; no trial we found has measured whether doing so changes heart attacks, cancers or deaths [22].
Look at the individual trials and the caution grows. In 50 Iranian women aged 30 to 60 with normal weight obesity, getting 25% of calories from protein instead of 15% for 12 weeks added 2.9 lb (1.30 kg) of lean mass and took off 3.0 lb (1.37 kg) of fat compared with a standard-protein diet, figures the journal corrected a year after publication [25] [26]. A six-month trial in 107 young Iranian women swapped a fruit snack for a soy one and reported 3.7 points off body fat against 0.9, with the soy group also eating about 166 fewer calories a day [27]. But its methods contradict themselves: one sentence says the women were “randomly allocated” “using a convenience allocation”, which is not random, and the next section describes “a computer-generated random number table” kept by an independent coordinator; and only those who finished were counted [27]. In 26 Korean women in their thirties, 12 weeks of combined aerobic and weight training on top of diet advice added 1.5 lb (0.70 kg) of lean mass, against a slight loss in women given the advice alone; the difference in fat lost, 2.4 lb (1.08 kg) against 1.1 lb (0.49 kg), could have been chance [28]. That paper’s text gives a bigger lean-mass gain than its own table; we used the table [28].
The longest trial is the least encouraging. In India, 292 adults with normal weight obesity were part of a two-year, peer-led lifestyle programme; against a comparison group, only blood pressure and good cholesterol improved, and slightly (we read the summary only) [30]. The trials in skinny-fat people that we read were almost all in women, and none counted a single heart attack, cancer or death [22] [24]. So the honest rating for “lifting and protein fix skinny fat” is Preliminary: they shift the body’s make-up in small, short trials, and no trial we found has tested, in people of normal weight, whether that lowers the risks above [22].
The wider evidence on training is stronger: our verdicts on whether lifting burns fat, on losing fat and gaining muscle at the same time and on how much protein muscle needs rate it in people of every size. You cannot choose where the fat comes off first, as the spot-reduction verdict explains. Whether any food, drink or exercise targets visceral fat in particular, which is what the videos go on to recommend, is a separate question, which our verdict on losing visceral fat rates: there, exercise shrinking visceral fat in people carrying extra weight is Established, and foods or drinks shrinking it beyond the weight they help lose, Preliminary.
Why am I still skinny fat even after working out?
Partly because the change is small and slow, and the scale hides it. In a 2026 study of 32 Chinese women with normal weight obesity, 12 weeks of supervised training three times a week took off 4.3 lb (1.93 kg) of fat and added 2.9 lb (1.32 kg) of lean mass, measured by DXA, while their weight did not change [29]. There was no comparison group, so some of that could be the women changing on their own [29]. In the Korean trial the weight moved by 0.8 lb (0.38 kg) in 12 weeks [28]. Changes of this size can also fall inside the error of a home body-fat scale: our verdict on those scales found that the band around one person’s measured change ran from plus or minus 3.4 to 5.2 points. A flat scale can hide real fat loss, as our verdict on muscle and fat explains.
Is 15% body fat too skinny?
Not by any line in these studies, for a man. In the 2010 study, the leanest third of normal-weight men were under 18.65% body fat, 14.8% on average [3]. For a woman, 15% is far below every range here: the leanest third of normal-weight women in the same study were under 28.9% [3]. Whether a reading is too low is a question none of these studies asked. Our verdict on body fat percentages covers the charts, where their lines came from and why they are softer than they look.
Why am I 200 pounds but look skinny?
Because BMI and the scale weigh everything at once. At 6 ft 3 in, 200 lb works out to a BMI of 25.0, the line between normal and overweight, by our arithmetic; add muscle and you can weigh more and look leaner, because muscle packs the same weight into less space than fat (our verdict on that). BMI’s cut-offs mislabel people in both directions: the same pooling that found them missing half of the people with too much fat found them wrongly flagging about one in ten of the rest [4].
Where “hidden fat” and “three-fold” came from
The trail we could document starts in breast tissue. In 2017 a New York team looked at breast fat removed at mastectomy from 72 women with a normal BMI and found inflammation in 39% of them, with signs of the metabolic changes usually seen in obesity [32]. It was a single look at each woman, and the paper concluded that this state “may contribute” to breast cancer [32]. The cancer centre’s news release, headlined “Study Uncovers Hidden Risk for Breast Cancer in Some Women”, said researchers had “shown for the first time” that this condition “can increase the risk of breast cancer” [31]. A later update to the release added the 2019 study and described the scans as “a better predictor of breast cancer risk than body mass index” [31]. The 2019 study found 1.89 times [14]; the 2013 analysis of the same scans had found BMI and waist predicting about as well as the scans [15].
By 2025 and 2026 the channel’s videos were carrying the idea as “invisible visceral fat”, a “Cornell ‘Skinny Fat’ Study”, “13 years” and “three-fold”, and a 59-second clip as “3X”: two videos and the clip, 2,528,996 views together when we counted them on 10 October 2026 [1]. We could not trace where “three-fold” came from: the descriptions name no study, and no study we read reports it [1] [14] [15] [16] [17] [19]. “13 years” is close to the 12.9 years of the 2013 analysis of women of every weight, not the 16 of the normal-weight one [14] [15]; whether that is where it came from, the descriptions do not say [1].
No product is sold with the cancer claim itself. The descriptions link the presenter’s online courses, a newsletter and books, and one of them goes on to recommend teas, foods and fasting to “burn visceral fat” [1]. On the search side, the AI answer for “skinny fat”, which lists heart disease, diabetes and high blood pressure among the risks and does not mention cancer, cites, among others, a maker of body-composition analysers, a seller of DXA scans, a hospital system’s weight-loss-surgery newsletter and a hospital that sells weight-loss surgery [2]. None of this is aimed at anyone who looks in the mirror and wonders. It is aimed at the step where 1.89 became three-fold, trunk fat became visceral fat, and a link no trial we could find supports became a promise to cut cancer risk by 3X [22].
What this is rated, and what the rating covers
Supported — for the claim that carrying a lot of body fat at a normal BMI, especially around the waist, is a health risk.
It is rated Supported because worse heart and metabolic risk factors appear consistently, in a pooling of studies and a 91-country survey [5] [7]; because a large waist at a normal BMI went with a higher death rate in two large American cohorts and a pooling of 11 cohorts and, for heart disease and strokes, in a Chinese one [6] [11] [12] [13]; and because more body fat went with more breast cancer after menopause in American and British women [14] [16]. It is not Established because every one of these studies is observational, there is no agreed definition, the 2010 study of body-fat percentage found no rise in deaths from all causes [3], and no trial we found set out to test, in people of normal weight, whether changing it changes the outcome [22]; the nearest, a diet trial, found no clear difference in breast cancer among its leanest women [39].
The parts, rated alone. Worse risk factors: Supported, the most consistent finding here. More deaths with a large waist at a normal BMI: Supported. More deaths with a high body-fat percentage at a normal BMI: Preliminary, whichever deaths are counted. From all causes, one study found a rise, two analyses of the same 1988–94 US survey by one research group found none, and one found it only in people with other warning signs [3] [8] [10] [34]. From heart disease, stroke and diabetes, counting each group of people once: in the US survey’s scans from 1999 on, one analysis found a rise [33]; in the UK Biobank, the same analysis found a rise overall, and a 2026 analysis of the same cohort found it only in people with more than two other warning signs, which the first had not allowed for [33] [34]; and in the 1988–94 survey, the 2010 study found a rise in women only, while the study of older adults is described both ways [3] [8] [33]. More breast cancer after menopause: Supported, as an association; other cancers: Preliminary, one study each [16] [18]. The videos’ “three-fold higher risk of breast cancer” over “13 years”: Unsupported; the figure was about 1.9 over 16 years [14]. “Visceral fat is the real culprit behind 14 other cancers”: Unsupported as stated; the list has 13, it was judged mostly on BMI, and at normal weight fat under the skin tracked breast cancer too [19] [21]. “Lose this to decrease your risk of cancer by 3X”: Unsupported. In two large trials that lowered weight or fat and counted cancers, nothing came near a threefold fall in people of normal weight: among the diet trial’s women with a BMI under 24.9, breast cancer ran at 0.89 times the rate, and in heavier adults with diabetes all cancers ran at 0.93 times, both differences that could be chance [35] [39]. Over nearly 20 years the diet trial showed little sign of any effect in women with a BMI under 30 [41], and its one near-threefold figure, for deaths from breast cancer in heavier women with several warning signs, was not explained by weight lost [43]. No trial we found has tested the claim as made, losing visceral fat in particular; an untested claim is not a disproven one, but no trial we found supports this one [21] [22]. Lifting and more protein changing a skinny-fat body: Preliminary [24] [25] [27] [28].
What is not rated here: how to lose visceral fat, which its own verdict rates; what the channel says about gut bacteria, stem cells or particular foods; and the frame in the section above, which is this desk’s reasoning from the evidence rather than a result the evidence delivered. It is marked as ours so that you can weigh it as ours. This page is journalism, not medical advice. How we read a study, and what each tier means, is set out here.
- Body Recomposition: In a 114-Trial Review, Lifting Alone Took Off 2.2 lb of Fat and Added 1.8 lb of Lean Mass, No Diet. It’s Not a Protocol. It’s the Default.
established - Are Body Fat Scales Accurate? One Reading Can Be 14.5 Points Off
unsupported - What Is a Good Body Fat Percentage? Your Scale’s Ranges Are Converted BMI
preliminary