Are Body Fat Scales Accurate? Right on Average. For One Person, Up to 14.5 Points Off — and a Glass of Water Moves It a Point.

The scale says 22.4%. It has a decimal place, which is a confident thing for a bathroom scale to have.
So here is the question, split the way the research splits it. Is that number accurate on average, across a lot of people? Yes, reasonably. Is it accurate for you, this morning? That is a different question, and the answer is a good deal wider than one decimal place.
What the scale is actually doing
It is not measuring fat. It is measuring water.
A body-fat scale sends a small, harmless electrical current up one leg and down the other. Water conducts electricity; fat does not, much. So the scale measures how much the current was resisted — the impedance — and from that, together with your height, weight, age and sex, an equation estimates how much of you is water, then how much is lean tissue, then, by subtraction, how much is fat. The method dates to the mid-1980s, when it was validated in a lab with electrodes on a hand and a foot [13]. Your bathroom scale uses feet only.
Every step of that is an estimate stacked on an estimate. Which is fine — the question is only how big the stack gets.
The test: three bathroom scales against an MRI
The cleanest study of ordinary consumer scales put 106 adults — normal weight through obese — on three foot-to-foot bathroom scales and one hand-to-foot device, and compared every reading against whole-body MRI and DXA, the two reference methods [1].
| People | 106 adults, normal weight to obese, average age 54 |
| Devices | three foot-to-foot bathroom scales and one hand-to-foot analyser |
| Reference | whole-body MRI and DXA |
| Group agreement | good — three devices within 1.5 points on average, one about 3 points low |
| One person, hand-to-foot | a reading could sit anywhere from 6.6 below to 4.6 above the real value |
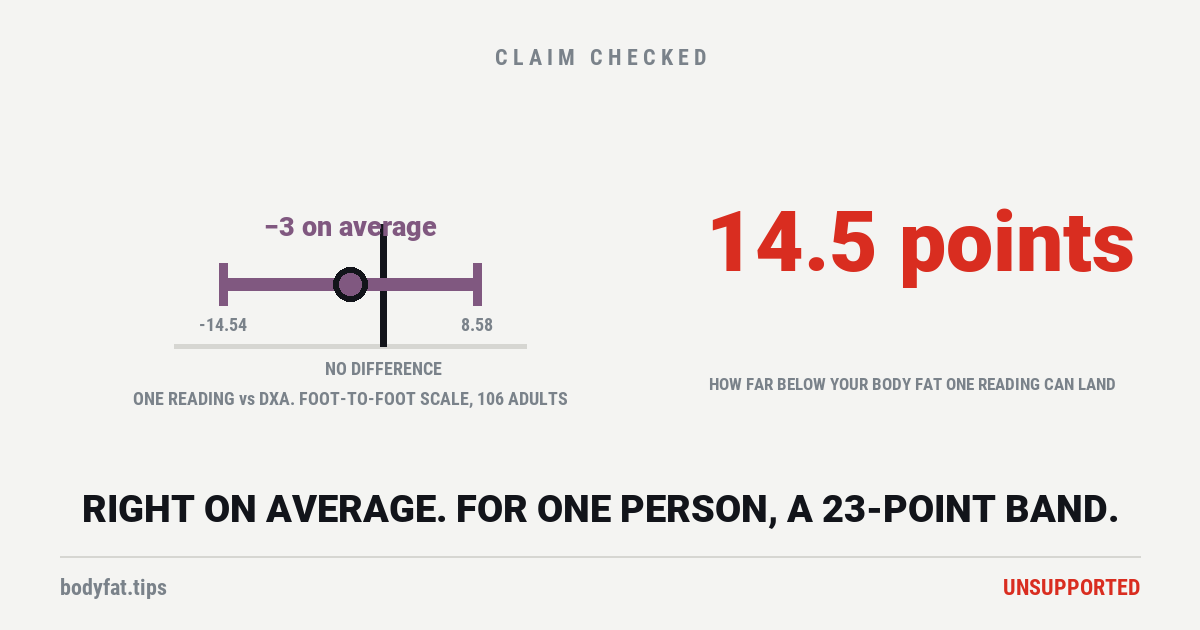
| One person, foot-to-foot | from 14.5 below to 8.6 above |
| Authors’ verdict | foot-to-foot scales are for groups. For an individual, use hand-to-foot |
On average, the scales were fine. Three of the four sat within 1.5 points of the reference; the correlations were strong [1]. If you lined up a hundred people and wanted the group’s average body fat, a bathroom scale would get you there.
Then look at the individual rows. A single reading from a foot-to-foot scale could sit anywhere from 14.5 points below the real value to 8.6 above [1]. That is the band inside which 19 of 20 readings land. So a display that says 22% is compatible with a real value of about 13, or about 31. The authors’ own conclusion: foot-to-foot scales are for “group estimation”; for an individual, use the hand-to-foot kind [1].
That is the whole page in one table. What follows is why.
The error has a direction, and it flatters the lean
If the scale were simply noisy — random, sometimes high, sometimes low — averaging a few readings would fix it. It is not simply noisy.
Body-fat scales tend to underestimate fat in leaner people and agree better in people carrying more of it, then flip at the extremes [2]. A study that tracked 48 active adults across six sessions found the disagreement with DXA was larger in women and depended on body size enough that the author concluded no blanket statement about the two methods could be made [2]. In schoolchildren, a manufacturer’s equation ran an average of 5.2 points low [3].
Averaging does not remove a bias. It just gives you the same wrong number more precisely.
A glass of water moves it a point
Seventy-six adults were measured, then drank 20 oz (591 ml) of water, then were measured again [5]. Twenty minutes later their body fat read 1.0 to 1.2 points higher — nothing about their bodies had changed except a pint of water in the stomach, which the current read as more resistance and the equation turned into fat. The effect was largest in the lightest people [5].
Push it harder and it gets stranger. Give people about 28 oz of water (11 ml per kg — that is the dose for someone weighing 165 lb) and stand them still for an hour, and a multi-frequency clinical analyser registered the added weight entirely as fat: about 2.9 lb (1.3 kg) of it [6]. Simply standing for the hour drifted the leg readings on its own.
A day of eating does the same in the other direction: after meals, impedance dropped and fat estimates fell 1.4 to 2.4% on average, with individual readings swinging up to 10% — and unlike DXA, the impedance readings had not settled back by the next morning’s fast [14].
Two studies pull the other way and belong here. One found food and drink shifted a foot-to-foot reading by about a point, which its authors judged “within the imprecision of the technique” and not clinically meaningful [7]. Another found a 400-calorie breakfast made no clinically relevant difference on a hand-to-foot device [8]. Read together with the rest: a point or two of wobble from what you ate and drank is real, it is smaller than the device’s own error, and it is exactly the size of the changes people get excited or despairing about week to week.
Can it at least track my progress?
This is the fallback everyone reaches for. Fine, the number is off — but if it is off consistently, I can watch the trend. Someone checked, over 21 weeks.
Seventy-two adults over 65, some exercising, some not, measured at weeks 1, 12 and 24 by nine different impedance equations and by DXA, all against a four-compartment lab model — the closest thing to ground truth that exists [9]. Single readings correlated well, as they always do. Then the researchers asked the only question that matters for tracking: for each individual, did the device get the change right?
Total agreement on individual change: 25% for impedance. And 27% for DXA [9].
Sit with the second number. The method most people treat as the gold standard tracked an individual’s change correctly about a quarter of the time, in a 21-week study, against the real reference. The scale was not meaningfully worse. This is not a scale problem. It is a measuring-one-person problem.
What the evidence supports is narrower and still useful: a large change over months, measured under the same conditions each time, will probably show up in the right direction. What it does not support is reading anything into a two-point move over a fortnight.
What about muscle mass?
Worse. Same physics, more assumptions. A 2025 trial put a wrist-worn BIA watch and a clinical hand-to-foot analyser against DXA in 108 active adults [4]. For body fat, both correlated strongly, with errors of 14% and 21% of the true value. For muscle mass, the correlations were still high but the agreement was rated weak on the standard scale — the devices and DXA tracked each other without landing on the same number [4]. If the scale tells you that you gained a pound of muscle this week, that is a sentence the technology cannot support.
So what is the most accurate way to measure body fat?
In a lab: a four- or five-compartment model that separately measures your water, your bone mineral and your body density and combines them. Nobody has one at home.
DXA is the best scan, and it is good — in obese adults its average agreed with the four-compartment model almost exactly, 41.1% against 41.5% [11]. But the same study found the individual differences between the two “sizable” [11], and you have just seen its 27% on tracking change [9]. It is the gold standard the way a good tape measure is: better than the alternatives, not the truth.
A clinical hand-to-foot analyser, the kind in a gym or a physio’s office, came within a total error of about 4 points overall against the four-compartment model — 2.5 in men, 4.7 in women [10]. Better than a bathroom scale. Not a decimal place.
Calipers and a tape? A purpose-built equation using three skinfolds and a waist measurement, checked against a five-compartment criterion, landed within a range of plus or minus 8.6 points for an individual [12]. That is with a trained person doing the pinching. In your bathroom, wider.
So the honest ranking is: lab model, then DXA, then a hand-to-foot analyser, then calipers done well, then the scale under your sink — and nothing outside a lab gets one person’s number to within about four points. Which is why the useful question was never “which is accurate” but “which is consistent enough to compare with itself”.
Where the decimal place came from
In 1985 a research group validated impedance as a lab method for fat-free mass — electrodes on the hand and the foot, so the current crosses the whole body [13]. In 1994 the first consumer body-fat scale went on sale, and to make it a scale you stand on, the electrodes moved to the feet. The current now runs up one leg and down the other and never sees your torso, where a good deal of the fat is. That foot-to-foot arrangement is the one with the 14.5-point error band; the hand-to-foot arrangement the method was validated with is the one with 6.6 [1].
Then the display printed the estimate to one decimal place, and a twenty-point band became “22.4%”.
Where it lives now: ask Google whether these scales are accurate and its AI Overview answers by citing Healthline, Houston Methodist and a PMC paper — and also a scale manufacturer’s own website, a weight-loss subscription programme, Reddit and YouTube. And “body fat scale” itself is searched 6,600 times a month with the highest advertiser competition in the whole cluster, because the thing people want to know about is the thing being sold.
None of that is aimed at anyone who owns one. The scale is not lying to you; it is estimating, and the display was designed by someone who did not want to print a range.
What a scale is actually good for
This verdict is not “throw it out”, because that is not what the evidence says either.
Weigh yourself on it. The weight is a real measurement, and what the scale weight does and does not tell you is a separate question this site has already taken.
If you use the body-fat number, use it as a yardstick, not a measurement. Same time of day, after the bathroom, before food or water, same scale. Ignore anything under two or three points. Look at months, not weeks. Under those conditions the direction of a large change is probably right, and that is the most the technology has been shown to deliver.
Do not chase the number to a target. The ranges those targets come from are softer than the charts imply, and now you know the reading is too. A soft target measured with a soft instrument is not a goal, it is two error bars overlapping.
What this is rated, and what the rating covers
Unsupported. The claim is that the body-fat number on a consumer scale is an accurate measurement of the person standing on it.
It is rated Unsupported because the best direct test found individual readings from foot-to-foot scales ranging from 14.5 points below to 8.6 above the reference [1]; because the error is systematic rather than random, running low in leaner people [2] [3]; because ordinary hydration shifts the reading by a point or more [5] [6] [14]; and because the one study that tested tracking found individual change correctly identified a quarter of the time [9].
What is not rated: use of these scales on groups, where the same study found them genuinely accurate [1]; hand-to-foot clinical analysers as a class, which do better [1] [10]; wearables, on one trial [4]; and what a body-fat percentage means once you have one, which is its own verdict. If what you are really trying to tell apart is fat and loose skin, that is here. How we read a study, and what each tier means, is set out here.