Are Ultra-Processed Foods Bad for You? In Short Feeding Trials, People Gained More or Lost Less. Why Is Still Open.

“Avoid Ultra-Processed Foods: 5 Simple Steps for Better Health.” That is the title of a 16-minute video posted on 15 December 2024 by a physicians’ explainer channel run by two orthopaedic surgeons with guest specialists. It had 202,807 views when we read its numbers on 10 October 2026 [1].
Its description asks the question this page is about: “Why should we be concerned about consuming too many of them?” Under “Articles Used” it links two papers [1]. One is a 2019 trial at the US National Institutes of Health in which 20 adults lived on a research ward and ate two diets in turn [2]. The other is a 2025 study that followed 38,148 American adults and counted deaths [3]. We read the description, not the video, so what was said on camera is not what this page rates.
Plenty of people are asking. In the United States, “ultra processed foods” is searched about 40,500 times a month, and “are ultra processed foods bad for you” about 170 times a month (from a paid keyword database, pulled 10 October 2026) [4].
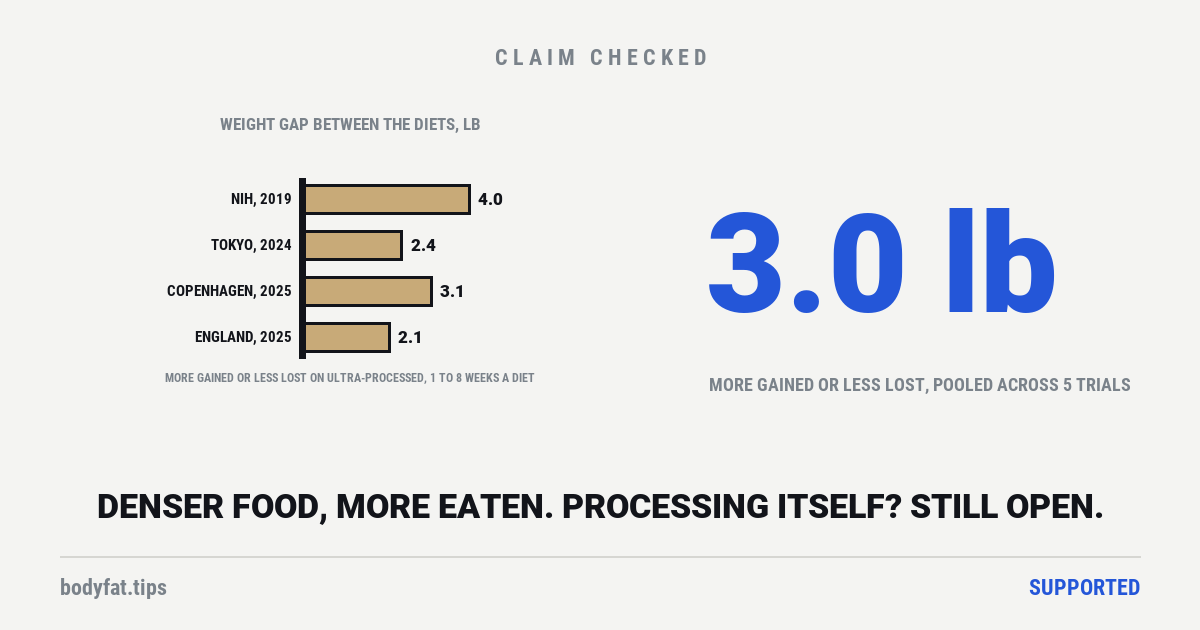
On diets made mostly of ultra-processed food, people in trials gained more weight, or lost less, than on diets of minimally processed food, and where the ultra-processed diet packed more calories into each gram, they ate more. Pooling five trials that weighed people, a 2026 review found about 3.0 lb (1.37 kg) more weight on the ultra-processed side, and rates its certainty in that figure low [5]. The five ran from one week to six months and enrolled 9 to 50 people each [5].
What the trials have not settled is why. In three of the trials, the ultra-processed diet also packed more calories into each gram of food [2] [6] [7], and when one NIH trial took that density and the foods easiest to overeat out of an ultra-processed diet, most of the overeating went [8]. A two-week trial that matched the diets for density, at fixed calories, found people ate no more at a buffet afterwards [9].
The links to disease and earlier death come from cohort studies, which follow people rather than feed them. The links are consistent, most are rated low or very low in certainty by the review that gathered them, and studies of this kind cannot separate the food from the lives of the people who eat the most of it [10] [3].
What things are ultra-processed food?
The term comes from a food classification called NOVA (a name, not an acronym [2]), built by a nutrition research group at the University of São Paulo. A 2024 review dates its first publication to 2009 [10]; the paper that set out the classification, in 2010, sorted foods by “the extent and purpose of the industrial processing applied to them” [11].
The version in use now has four groups, set out in the same group’s 2019 guide [12]. Group 1, unprocessed or minimally processed: fresh vegetables and fruit, roots and tubers, grains, beans and lentils, nuts, pasteurised milk and chilled meat, altered only by steps such as drying, grinding, freezing or pasteurising, none of which adds salt, sugar, oil or fat. Group 2, processed culinary ingredients: oils and fats, sugar and salt. Group 3, processed foods: group 1 foods with salt, sugar or oil added, canned or bottled, and breads and cheeses made by fermentation. Group 4, ultra-processed: “formulations of ingredients, mostly of exclusive industrial use, that result from a series of industrial processes” [12].
The guide’s own examples of group 4: soft drinks, sweet or savoury packaged snacks, chocolate, candy, ice cream, mass-produced packaged breads and buns, margarines and spreads, cookies, pastries, cakes and cake mixes, breakfast cereals, ready-made pies and pasta and pizza dishes, chicken and fish nuggets and sticks, sausages, burgers, hot dogs and other reconstituted meat, and instant soups, noodles and desserts [12]. Processed meat has its own verdict here.
How to identify ultra-processed foods
The guide’s test is the ingredients label. A product is ultra-processed if its list includes at least one food substance “never or rarely used in kitchens”, such as high-fructose corn syrup, invert sugar, maltodextrin, dextrose, hydrogenated oil, hydrolysed protein, soya protein isolate or whey protein, or at least one of a set of “cosmetic additives”: flavours, flavour enhancers, colours, emulsifiers, sweeteners, thickeners, and foaming, gelling or glazing agents [12]. Emulsifiers, maltodextrin, sweeteners and hydrogenated oils each have their own verdict on this site.
The categories have moved over time. The 2010 paper had three groups, not four; its ultra-processed group took in breads, and high-fructose corn syrup and milk and soy proteins sat with the cooking ingredients [11]. In the 2019 guide, an industrial bread made only from flour, water, salt and yeast is a processed food, not an ultra-processed one, and those same industrial ingredients now mark a product as ultra-processed [12].
Ultra-processed foods vs processed foods: where is the line?
The 2019 guide draws it with breakfast. Plain steel-cut oats, plain corn flakes and shredded wheat are minimally processed; the same foods with sugar added are processed; add flavours or colours and they are ultra-processed [12]. Bread works the same way: flour, water, salt and yeast is processed, and an emulsifier or a colour in the list tips it over [12]. By the guide’s rule, the line is drawn by what is on the ingredient list, not by the calories, the sugar or the salt on the nutrition panel.
Is white sugar ultra-processed?
No, not by NOVA. Sugar, salt and plant oils are group 2, processed culinary ingredients, and the guide says plainly that they “are also not ultra-processed” [12]. What changes the answer is the form on a label: fructose, high-fructose corn syrup, ‘fruit juice concentrate’, invert sugar, maltodextrin, dextrose and lactose are on its list of substances that mark a product as ultra-processed [12]. A bag of sugar is not ultra-processed; by the guide’s rule, a cereal sweetened with dextrose is. What sugar does to you is a separate question, with its own verdict.
Is MSG considered an ultra-processed food?
The guide lists flavour enhancers, the class monosodium glutamate belongs to, among its cosmetic additives, and gives ‘monosodium glutamate (flavour enhancer)’ as an example of how one appears on a label [12]. So a packaged food that lists it counts as ultra-processed by that rule. The guide does not say how it would class a jar of MSG bought on its own as a seasoning, and we will not guess.
What are some examples of non-processed foods?
In NOVA’s terms, these are group 1: fresh or frozen vegetables and fruit, potatoes and other roots, grains, beans and lentils, nuts, pasteurised milk, fresh or chilled meat, plain oats, and tea, coffee and tap water [11] [12]. Drying, freezing, grinding or pasteurising does not move a food out of group 1, because nothing is added [12].
Can experts agree on what is ultra-processed?
Not as well as the term’s confidence suggests, and the two studies we read point different ways. In France, 159 food and nutrition specialists sorted 120 supermarket products, with their ingredient lists, into the four groups; another 177 sorted 111 foods described only by name [13]. Their agreement, measured by a statistic called kappa, was 0.32 and 0.34 [13]. Kappa measures agreement beyond what chance alone would produce: 1 is perfect agreement, 0 is no better than chance. Only three of the 120 products, and one of the 111 foods, were put in the same group by everyone, and plain unsweetened dairy products were placed in all four groups [13]. The authors found that giving people the ingredient list did not make them agree more [13].
That study was partly paid for, under 5% of its cost, by a French fund the authors describe as “partially sponsored by the food industry”, and its first author works for a nutrition consultancy [13]. A US study found much better agreement: pairs of coders, trained and certified first, sorted 3,099 foods from young children’s dietary records and agreed 88.3% of the time, a kappa of 0.75 [14]. It was federally funded [14]. The two measured different things: many specialists reading NOVA’s written rules for themselves, against trained pairs working the same way. Our reading is that NOVA can be applied consistently by people trained to apply it alike, and is not applied consistently by experts left to interpret it.
Do ultra-processed foods make you eat more and gain weight?
The trial the video links is the oldest of the ten in the newest review’s list [5]. In 2019, 20 adults, average age 31, lived on a research ward at the NIH Clinical Center for four weeks [2]. For two weeks they were served an ultra-processed diet and for two weeks an unprocessed one, in random order, and were told to eat as much or as little as they liked [2]. This design is called a crossover: each person ate both diets, so each was compared with themselves. The menus were built to offer the same calories, sugar, fat, salt and fibre [2]. The same research group’s ward studies of low-carb and low-fat diets appear in our verdict on cutting carbs.
On the ultra-processed diet they ate 508 calories a day more [2]. They gained 2.0 lb (0.9 kg) in those two weeks and lost 2.0 lb (0.9 kg) on the unprocessed diet [2]. They did not rate the ultra-processed meals as clearly more pleasant or familiar, and their hunger and fullness scores showed no clear difference [2]. Two things did differ. They ate faster, by 17 calories a minute. And the food itself, drinks aside, carried nearly twice the calories per gram, 2.15 against 1.15 on the menus’ own figures; the diets matched on that measure only because the ultra-processed menus included drinks with fibre dissolved in them [2].
The authors are plain about the limits. The study “was not designed to identify the cause” of the extra eating, it had no warm-up period and no gap between the two diets, and a hospital ward is not a kitchen [2]. The journal has printed two corrections to the paper. The 2019 one fixes typing errors, among them the unit of the table’s non-beverage energy density, which should read calories per gram and not per day (this page gives it per gram), and two fibre shares printed the wrong way round. The 2020 one fixes one participant’s meal records, which changed the meal-by-meal figures and not the daily totals [2].
Five more trials we read have served whole ultra-processed diets against less-processed ones for a week or longer.
| Trial | How they ate | What happened |
|---|---|---|
| United States, 2019; 20 adults on a hospital ward, 2 weeks each [2] | As much as they liked; menus matched for calories, sugar, fat, salt and fibre as served | 508 calories a day more on ultra-processed; 2.0 lb (0.9 kg) gained on it, 2.0 lb (0.9 kg) lost on unprocessed [2] |
| Japan, 2024; 9 men on a hospital ward, 1 week each [6] | As much as they liked; meals matched for calories and nutrients as served | 813.5 calories a day more; 2.4 lb (1.1 kg) more gained in the ultra-processed week [6] |
| Denmark, 2025; 43 men at home, 3 weeks each [15] | The same fixed calories on both diets; what they ate was self-reported | 3.1 lb (1.41 kg) heavier after ultra-processed when fed to their needs; 2.8 lb (1.28 kg) when overfed [15] |
| England, 2025; 55 adults, 50 analysed, at home, 8 weeks each [7] | As much as they liked; both diets met UK healthy-eating guidance | Weight fell on both: by 2.06% on minimally processed, 1.05% on ultra-processed [7] |
| United States (Virginia), 2026; 27 adults aged 18 to 25, food provided, 2 weeks each [9] | The same fixed calories on both; diets matched for calories per gram (1.3 against 1.2), nutrients and diet quality; a buffet breakfast after each | Weight fell on both, by 0.9 lb (416 g) on ultra-processed and 1.1 lb (477 g) on the other, a gap the trial could not tell from chance; at the buffet, no more eaten after ultra-processed [9] |
| United States, results posted 2026; 36 adults on a hospital ward, 1 week on each of 4 diets [8] | As much as they liked; three ultra-processed diets differing in energy density and in hyper-palatable foods, and one unprocessed | 948 calories a day more on the ultra-processed diet high in both than on unprocessed; 128 more on the one low in both, a gap the trial could not tell from chance [8] |
In Tokyo, nine overweight young men spent a week on each diet in hospital, two weeks apart [6]. They ate 813.5 calories a day more in the ultra-processed week and gained 2.4 lb (1.1 kg) more in it than in the other [6]. Both weeks put weight on them; the ultra-processed week put on more [5]. They also chewed less for every calorie [6].
In Copenhagen, 43 young men ate each diet for three weeks at home, with the calories fixed and the same on both [15]. After the ultra-processed diet they weighed 3.1 lb (1.41 kg) more than after the unprocessed one when fed to their needs, and 2.8 lb (1.28 kg) more when overfed, about 2.1 to 2.2 lb (0.96 to 1.00 kg) of it fat [15]. More weight at the same calories would be a striking result. The authors flag the catch themselves: intake was not watched, so the matched calories rest on what the men reported eating [15].
The longest of these trials ran in England. 55 adults, 91% of them women, were assigned to eat each diet for eight weeks at home, with all food delivered and both diets built to meet the UK’s healthy-eating guide; 50 were analysed [7]. The ultra-processed diet used the kind of products sold as better choices, breakfast cereals, ready meals and plant-based alternatives, many carrying nutrition or health claims [7]. People lost weight on both: 2.06% of their body weight on the minimally processed diet and 1.05% on the ultra-processed one, a gap of about 2.1 lb (0.96 kg) [7]. Fat mass fell more on the minimally processed diet, by about 2.2 lb (0.98 kg), and so did triglycerides, a blood fat [7]. LDL cholesterol went the other way: it fell more on the ultra-processed diet, by about 10 mg/dL (0.25 mmol/L), by our conversion [7]. Blood pressure, blood sugar and waist size showed no clear difference between the diets [7]. Whichever diet came second produced less weight loss, which the authors put down partly to people sticking to it less [7]. All 12 people who dropped out did so during the minimally processed diet or in the break straight after it [7], and people liked the ultra-processed diet more, 6.3 against 5.2 on a 10-point scale, by the review’s table [5].
In Virginia, people aged 18 to 25 spent two weeks on each diet, 27 of them analysed, 81% of calories from ultra-processed food against none, with the food provided and the calories fixed, the same on both [9]. The two diets were matched for nutrients and overall diet quality, and described as matched for calories per gram, 1.3 against 1.2 on a 2,000-calorie menu; the paper does not say whether drinks are counted in those figures, and in the 2019 trial counting the drinks was what made the diets look matched [9] [2]. Fixed calories mean the trial could not test whether people overeat on the diet itself. What it could test was appetite at a buffet breakfast after each diet; weight was held steady by design, the calories set to maintain it within a 1 kg (2.2 lb) range the trial allowed for day-to-day swings. Weight fell on both, inside that range, by 0.9 lb (416 g) on the ultra-processed diet and 1.1 lb (477 g) on the other, a gap the trial could not tell from chance; at the buffet, people ate no more after the ultra-processed diet [9]. In a split the authors call exploratory, the 11 aged 18 to 21 ate more at the buffet after the ultra-processed diet, while the 16 aged 22 to 25 ate slightly less, a gap the trial could not tell from chance [9]. The trial was funded by the US National Institutes of Health, and its authors declare no conflicts [9].
Then the NIH team tried to take the ultra-processed diet apart. In a trial that finished in August 2025, 38 adults started and 36 finished four weeks on the ward, eating four diets, a week each, in random order: three ultra-processed and one unprocessed [8]. The ultra-processed diets differed in two things. One was energy density, the calories in each gram of food, counting food only, not drinks. The other was how many hyper-palatable foods they held, a research label for foods whose combinations of fat, sugar, salt or carbohydrate pass set cut-offs thought to make them easy to overeat; we did not read the cut-offs this trial used [8].
Its results, posted on the trial registry in August 2026, are the trial’s own model-adjusted averages [8]. On the ultra-processed diet high in both, people ate 3,424 calories a day; on the unprocessed diet, 2,476: a gap of 948 [8]. On the ultra-processed diet low in both, they ate 2,604, which is 128 more than on unprocessed, with a p-value of 0.065, just the wrong side of the line researchers use for ‘probably not chance’ [8]. By our arithmetic, about seven-eighths of the excess went when density and the hyper-palatable foods were taken out, while the food stayed ultra-processed. Eating speed, measured as grams of food a minute, and how pleasant people found the meals showed no clear difference across the four diets [8]. The same grams a minute on a denser diet means more calories a minute, so on the two denser diets people took in calories faster; that is our arithmetic, and the registry does not give the densities to say by how much. We found no paper of these results, and a registry entry has not been through a journal’s review [16].
What do all the trials add up to?
A review published in 2026, searched to November 2025, gathered ten randomised trials comparing ultra-processed with less-processed food [5]. On weight, five trials pooled to about 3.0 lb (1.37 kg) more on the ultra-processed side, with a plausible range for that average from 2.2 to 3.8 lb (1.00 to 1.74 kg) [5]. The largest of the five by number of people is the English trial; the review reports that leaving out the largest or the smallest single result did not change the answer much [5]. The largest single result, the widest gap between two diets, is the Brazilian advice trial’s, whose direction the review itself reports two ways (below); without it, the other four trials still pooled on the side of more weight, clear of chance [5]. Counted the other way round, by our arithmetic from the review’s chart, the pooled result would no longer be clear of chance. On calories eaten, across seven trials including some that measured a single meal, the pooled effect was 0.34 on a scale where 0.2 is small, 0.5 moderate and 0.8 large, and its plausible range still allowed for none at all [5].
The split that matters is energy density. Where the ultra-processed food packed more calories per gram than the comparison, people ate clearly more, an effect of 0.71; where it did not, the effect was 0.02, nothing to speak of [5]. The authors rate their certainty low for both the calorie result and the weight result, because the trials are few, their results differ, the ranges are wide and there are signs that some results may not have been published. Their certainty that processing does anything apart from the food’s nutrient make-up is very low, because, they found, the trials’ diets were not matched on nutrients [5].
Of the eight trials in that review that served the food, the longest ran eight weeks a diet [5]. Two that gave advice instead ran 16 weeks and six months [5]. One of those, in Brazil, added advice to cut ultra-processed food to a calorie-cut diet for 43 adults with obesity, 34 of them analysed after six months; its summary reports waist size and body fat falling in both groups; its weight results are not in the summary we read [17]. The review reports them two ways. Its table of trials gives the group told to cut ultra-processed food a gain of 2.3 lb (1.06 kg) and the other group a loss of 7.5 lb (3.41 kg), which would put this trial against the rest; its chart counts the trial as the strongest result on the side of more weight with ultra-processed food [5]. We could not read the trial’s paper, which sits behind the publisher’s paywall, to say which is right; its summary, its supplement and a conference abstract of the same analysis give no weight figure for either group [17]. Those 34 people come from a larger trial, registered under the same number: the same research group’s 12-month report of 148 adults with obesity on the same two diets [18]. It says the group advised to cut ultra-processed food lost more weight, a difference its authors call statistically but not clinically significant; that group’s share of calories from ultra-processed food fell only to about 14%, against 20% in the other, a gap just the wrong side of the line researchers use for ‘probably not chance’ (p = 0.08) [18]. The review left the 12-month report out for that reason, while pooling the six-month analysis of 34 people from the same trial [5]. In the lead author’s doctoral thesis on the trial, six months in, the group told to cut ultra-processed food had lost 2.25% of its starting weight and the other 1.37%; at the planned weighings the gap was one the trial could not tell from chance, and it crossed that line only when every monthly weighing was counted [19]. We read the 12-month report’s summary and figures and the thesis, not the published paper’s text.
Are there healthy ultra-processed foods?
The English trial is the closest test. Its ultra-processed diet met the UK’s healthy-eating guidance and was built from reformulated products with health claims [7]. It was also denser: 1.60 calories per gram against 1.25 for the minimally processed diet, by the review’s table [5]. People still lost weight on it, and it did better than the minimally processed diet on LDL cholesterol; for weight it did about half as well, over eight weeks, in people whose usual diet was about two-thirds ultra-processed [7]. A single-meal test in the newest review’s list leans the other way: a nutritionally high-quality ultra-processed breakfast was eaten in about the same amount as a less-processed one, 610 against 586 calories [5].
Adding protein did not fix the overeating, at least over two days. In a German study in a sealed room that measures the calories people burn, 21 young adults ate two ultra-processed diets for 54 hours each, one with 30% of its calories from protein and one with 13% [20]. The high-protein version cut intake by 196 calories a day, and people still ate past their needs on both: 18% over on the high-protein diet, 32% on the other [20]. The authors note that more expensive ultra-processed products labelled ‘high in protein’ are a growing part of what is sold [20].
And in the 2025 mortality study, ultra-processed food did not behave as one thing: sugary drinks and ready-to-eat mixed dishes went with more deaths, while ultra-processed vegetable and legume products went with fewer [3].
Do ultra-processed foods shorten your life?
This question has to be answered without a feeding trial: the umbrella review’s authors write that a trial of long-term exposure to a diet suspected of harm, with disease as the outcome, will not be possible “for obvious ethical reasons” [10]. What exists are cohort studies: measure what people eat, then wait and see who falls ill or dies. They show what goes together. They cannot show what causes what.
The largest summary is that 2024 umbrella review, a review of reviews, covering 45 pooled analyses and almost 9.9 million people [10]. It graded the evidence two ways. By its own credibility rules it rated four links ‘convincing’: deaths from cardiovascular disease, 50% higher among people eating more ultra-processed food; type 2 diabetes, 12% higher for each step up in intake the studies measured; anxiety; and common mental disorders [10]. Deaths from any cause, 21% higher, and obesity were ‘highly suggestive’ [10]. But by GRADE, a standard scale for how sure the evidence lets you be, none of the 45 rated high: 4 moderate, 22 low and 19 very low, and the cardiovascular-death link it called convincing was among the very low [10]. For cancer the picture was weaker: cancer overall was ‘suggestive’ at very low certainty, and breast, pancreatic and prostate cancer showed no clear link [10].
The study the video links followed 38,148 American adults for a median of eight years, during which 4,611 died [3]. For every 10 percentage points more of their calories that came from ultra-processed food, the risk of dying at any given time ran 9% higher than in otherwise similar people, a hazard ratio of 1.09 [3]. Allowing for the overall quality of their diets cut that to 6% [3]. Deaths from heart disease, stroke and diabetes were not clearly linked once the authors allowed for people’s health at the start, and the study found no clear link with cancer deaths [3].
Two things limit all of this. The first is the people. Those who eat a lot of ultra-processed food may differ from those who eat little in ways a study did not measure, and a study can adjust only for what it measured; the umbrella review’s authors call residual confounding, the differences left over, ‘perhaps most pertinent’ [10]. The second is the measuring. NOVA was applied after the fact, by researchers sorting the foods people reported eating. In the US study that meant one or two days of recalled meals at the start, and the authors note that brands and ingredient lists were missing for some foods, which ‘could lead to misclassification’ [3]. In 87% of the umbrella review’s pooled analyses, intake came from a mix of questionnaires, recalls and diet histories [10].
Then what is it about ultra-processed food that makes people eat more?
This section is the desk’s own reasoning, and it is labelled as such. In the ward trials, people ate more on the usual ultra-processed diets researchers served [2] [6] [8]. The trials do not agree on why. Three answers, each rated.
Answer one: calories per gram. In the NIH four-diet trial, taking density and hyper-palatable foods out of an ultra-processed diet removed about seven-eighths of the excess, by our arithmetic from its posted figures [8]. In the 2026 review, the excess appeared where the ultra-processed food was denser and not where it was not [5]. This is measured, in one week-long trial whose results are not yet in a paper and in one part of a review of small trials. A two-week trial matched for density, which found no more eaten at a buffet afterwards, fits it too, though it tested one meal and not the diet [9].
Answer two: eating speed. In Wageningen, 41 adults ate two ultra-processed diets for two weeks each, matched for calories per gram and for how much people liked them, but built from foods with different textures; on the slower-eating diet they ate 369 calories a day less [21]. Their weight showed no clear difference over two weeks, and fat mass fell by 0.9 lb (0.43 kg) on the slow diet [21]. In the NIH four-diet trial, people ate about the same weight of food a minute on all four diets, while intake differed by up to 948 calories a day [8]. That does not count against speed: on the denser diets the same grams a minute meant more calories a minute, so the trial fits the speed answer as well as the density one and does not separate them; the calories-a-minute step is our arithmetic. Both results are measured. The conclusion that speed is one cause among several is ours.
Answer three: too little protein. In the 2019 trial, people ate the same amount of protein on both diets and more of everything else, which fits an idea called protein leverage: that people keep eating until they have had a set amount of protein, so a diet thinner in protein gets eaten in larger amounts [2]. The authors calculated it could explain at most about half the excess [2]. In the German study, adding protein to an ultra-processed diet cut intake by 196 calories a day and did not stop people overeating [20]. This is a surmise with some evidence on its side, and the evidence caps it below the whole answer. Protein and fullness have their own verdict.
Put the three together and here is what we think is true, stated plainly so you can disagree with it: what the trials have caught is a kind of diet, dense in calories, soft and quick to eat, and ‘ultra-processed’ is the label that usually comes with it, not yet the proven reason.
What we could not find, and would like to: a trial that served an ultra-processed diet matched to a minimally processed one for calories per gram, texture and hyper-palatable foods, for months, and weighed people at the end [16]. The nearest finished tests are short. The NIH four-diet trial ran a week a diet [8]. The Virginia trial matched the diets for calories per gram for two weeks a diet, but fixed the calories, so it tested appetite at one meal afterwards rather than eating on the diet itself [9]. On the ClinicalTrials.gov registry we found six trials with no full report whose entries set ultra-processed food against less-processed food in diets matched for nutrients, food groups or diet quality [22] [23] [24] [25] [26] [27]. Three set whole diets against each other: one at Laval University in Quebec, six weeks with the calories fixed to hold weight steady, recruiting; one in Göteborg, Sweden, in what its entry calls a weight-stable context, measured at two and six weeks, recruiting; and one in Belfast, four months on a healthy plant-based diet high or low in ultra-processed food, with weight among its measures, not yet recruiting. Two swap only part of a diet: one in Milan, three months each on the same Mediterranean diet at equal calories, with or without five ultra-processed servings a day, whose 2025 conference report had four people through the trial, eating 35% of their calories from ultra-processed food on one diet against 15% on the other, and no clear change in weight so far; and one in Toronto, with soy foods high or low in processing inside a 12-week guideline diet programme, weight among its measures, recruiting. The sixth, a US trial of whole diets meeting the national dietary guidelines, at steady calories, was withdrawn before anyone enrolled, though its protocol is published. None of the six entries says it will match the diets for calories per gram. If you know of a longer one, the corrections line on this site is open.
Who paid for the research on both sides?
Money runs through this subject in both directions, so here it is. The study that found experts agreed poorly on NOVA was partly paid for by a fund backed in part by the food industry [13]. The 2026 trial that tied overeating to eating speed was funded by a public–private partnership, and its lead author declares speaking fees from confectionery, snack and breakfast-cereal companies and a sugar-industry research body [21]. The 2026 review that found the calorie effect uncertain was led by a researcher who, in 2014 to 2016, was an investigator on projects funded by a consumer-goods company and a soft-drink industry association, and who declares no fees from the food industry [5].
On the other side, two authors of the English trial receive royalties from books about or mentioning ultra-processed food, one of them also paid for broadcasting on it [7]. Eight of the umbrella review’s 15 authors work at a centre funded in part by a ready-meal company and two dairy companies, and its lead author is an associate investigator on a trial of diets at different levels of processing, part-funded by the ready-meal company [10]. NOVA’s 2019 guide calls ultra-processed foods ‘intrinsically unhealthy’ and says they are not ‘real food’ [12], and one author of the mortality study the video links is a co-author of that 2019 guide [3] [12]. None of that makes a result wrong. It is why we read the numbers rather than the summaries.
Who these studies were done on
The feeding trials: 20 American adults, average age 31, without diabetes [2]; nine overweight Japanese men aged 18 to 39 [6]; 43 Danish men aged 20 to 35 [15]; English adults with a body mass index of 25 to 40, nine in ten of them women, whose usual diet was about two-thirds ultra-processed [7]; 36 American adults aged 18 to 60 without diabetes [8]; and 27 Americans aged 18 to 25, average age 22 [9]. The feeding trials we read were all in people 18 or older; in the trial with the youngest people, an exploratory split found those aged 18 to 21 ate more at a buffet after the ultra-processed diet, and those aged 22 to 25 slightly less [9]. The mortality study is of US adults aged 20 and over [3].
Three things change how far this applies to you. Your starting diet: the English trial’s people began at about two-thirds ultra-processed and lost weight on both diets [7]. Your sex: two of the trials enrolled only men, and the longest was nine-tenths women [6] [15] [7]. And time: no feeding trial on this page ran a diet longer than eight weeks, which says nothing either way about years.
Where “avoid ultra-processed foods” came from
The classification came first, from São Paulo in 2010, applied there to Brazil’s household food purchases [11]. The research that gave it teeth came in 2019, when the NIH ward trial found 508 more calories a day eaten on the ultra-processed diet [2].
The framing was in that paper’s title: “Ultra-processed diets cause excess calorie intake and weight gain”, true of the diets it served, over a text that says the study was not designed to find out why [2]. The 2024 umbrella review then called a link with cardiovascular deaths ‘convincing’, at a certainty its own GRADE rating put at very low [10].
Then the spread. “Avoid Ultra-Processed Foods: 5 Simple Steps for Better Health”, posted in December 2024 and past 200,000 views, linking the ward trial and the mortality study [1]. In October 2026, Google’s AI answer for “ultra processed foods” put faster eating that can ‘override natural fullness cues’ and links to ‘all-cause mortality’ under the heading ‘Why Are They Harmful?’ [4]. The links are real; the heading turns cohort findings into causes. Faster eating is one of the three answers above, measured in trials and not settled; in the NIH four-diet trial people ate about the same grams a minute on every diet [8], which on the denser ones, by our arithmetic, meant more calories a minute.
The product is the shelf’s answer: reformulated ultra-processed foods sold with health claims, the breakfast cereals, ready meals and plant-based alternatives of the English trial’s healthy ultra-processed diet, and products labelled ‘high in protein’ [7] [20]. In the trials, the first still lost less weight than minimally processed food and the second was still eaten past need [7] [20].
None of this is aimed at anyone who eats ultra-processed food, which, by the figures the mortality study cites, supplies more than half the calories American adults eat [3]. It is cheap, it keeps and it is quick, and the 2019 trial’s own authors wrote that cooking from minimally processed food takes time, skill, money and effort that many people do not have [2]. What the evidence does not carry is the certainty of ‘avoid’ when it is attached to disease and death, or the health halo on the reformulated products sold as the fix.
What this is rated, and what the rating covers
Supported — for the claim that diets made mostly of ultra-processed food, as most trials have served them, lead people to gain weight, or lose less, than diets of minimally processed food, over the one to eight weeks the trials have run, and to eat more where the ultra-processed diet packed more calories into each gram, as it did in four of the six whole-diet trials on this page.
It is rated Supported because the direction held in every whole-diet feeding trial we read that let weight move and reported it: people came out heavier, or less light, after the ultra-processed diet [2] [6] [15] [7]; the five weighed trials in the review pooled to about 3 lb, and without the Brazilian advice trial, whose direction the review reports two ways, the rest still pooled on the side of more weight, clear of chance [5]; and in each ward trial of the usual dense ultra-processed diet people ate several hundred calories a day more [2] [6] [8]. The Virginia trial, which fixed the calories to hold weight steady, counts neither way: weight stayed inside the 1 kg (2.2 lb) range the trial set for it on both diets, and the gap between them was one the trial could not tell from chance [9]. It is not Established because the trials are few, small and short; the pooled calorie effect across all of them was not clear and depended on energy density; the review rates its certainty low, for weight and for calories alike [5]; the trial on this page that served an ultra-processed diet low in density and in hyper-palatable foods found an excess it could not tell from chance [8]; and the one that matched density at fixed calories found no more eaten at a buffet afterwards [9].
Rated alone, in words. That ultra-processed food shortens your life or causes disease: Preliminary. The links are consistent across large cohorts, but most are rated low or very low in certainty, the US study’s link was small and shrank with diet quality, and no cohort can separate the food from the people who eat it [10] [3]. That it is the processing itself, rather than calorie density, texture or nutrients, that makes people overeat: Preliminary. One trial at fixed calories leans that way, on self-reported intake [15], and, weakly, so does an exploratory split in another, in which those aged 18 to 21 ate more at a buffet afterwards and those aged 22 to 25 slightly less [9]. The NIH four-diet trial, the review’s density split, and that second trial’s full result, with the diets matched for density and no more eaten, lean the other [8] [5] [9]. So, as single-meal tests, do two trials published in 2026, after the review’s search, that served fixed portions: in one, whether the meals were ultra-processed made no clear difference to how much people ate at dinner; in the other, a firmer ultra-processed lunch was followed by the least snacking [28] [29].
And one that was tested. That an ultra-processed diet meeting healthy-eating guidance does as well for weight as a minimally processed one: Unsupported, of the tested kind. The trial in the newest review’s list that tested it over weeks, with weight measured, found about half the weight loss over eight weeks, while LDL cholesterol did better on the ultra-processed diet [7] [5]. That rests on one eight-week trial of 50 people, on its main measure, with a p-value of 0.024, inside the line researchers use for ‘probably not chance’ [7]. Three things temper it: the order the diets came in changed the size of the result, everyone who dropped out did so on or just after the minimally processed diet, and the ultra-processed diet was itself denser, 1.60 calories per gram against 1.25 [7] [5]. So it is a test of reformulated ultra-processed products as sold, not of processing alone.
What is not rated here: whether NOVA sorts foods consistently, where the two studies we read point different ways [13] [14]; any single additive, which the linked verdicts cover; the video’s five steps, which its description does not list; and the frame above, which is this desk’s reasoning from the evidence rather than a result the evidence delivered. It is marked as ours so that you can weigh it as ours.
This is journalism, not medical advice. If you have a condition managed by diet or medicines, take any big change in what you eat to the clinician who manages your treatment first. How we read a study, and what each tier means, is set out here.
- How to Reverse Insulin Resistance: A 5% Weight Loss Improved It by About a Quarter. In Pooled Type 2 Diabetes Trials, Low-Carb’s Lead on Blood Sugar Had Halved by 12 Months.
established - Is Breakfast the Most Important Meal of the Day? Not for Your Weight. People Assigned to Eat It Lost No More Than People Assigned to Skip It.
supported - Can Plaque in Arteries Be Reversed? Diets Slowed It in Small Trials. Drugs That Push LDL Very Low Shrank It About One Percentage Point of Artery Volume.
preliminary