How Many Calories to Lose a Pound? 3,500 Is a Conversion, Not a Speed

Cut 500 calories a day and you will lose a pound a week. It is the most repeated number in weight loss, it is printed on apps and handouts, and it comes from dividing 3,500 by seven.
The number itself has a real basis. It traces back to a 1958 paper that worked out the calorie equivalent of gained or lost weight from the weight obese patients actually lost on a strict diet, and offered it as a way to predict weight loss. [4] The same paper warned that the calories you burn fall as your weight falls. The pound-a-week promise keeps the arithmetic and drops the warning.
The problem is what happens when you run it forward.
The rule, doing its own arithmetic
| Daily deficit | 500 calories |
| Over one week | 3,500 calories → 1.0 lb |
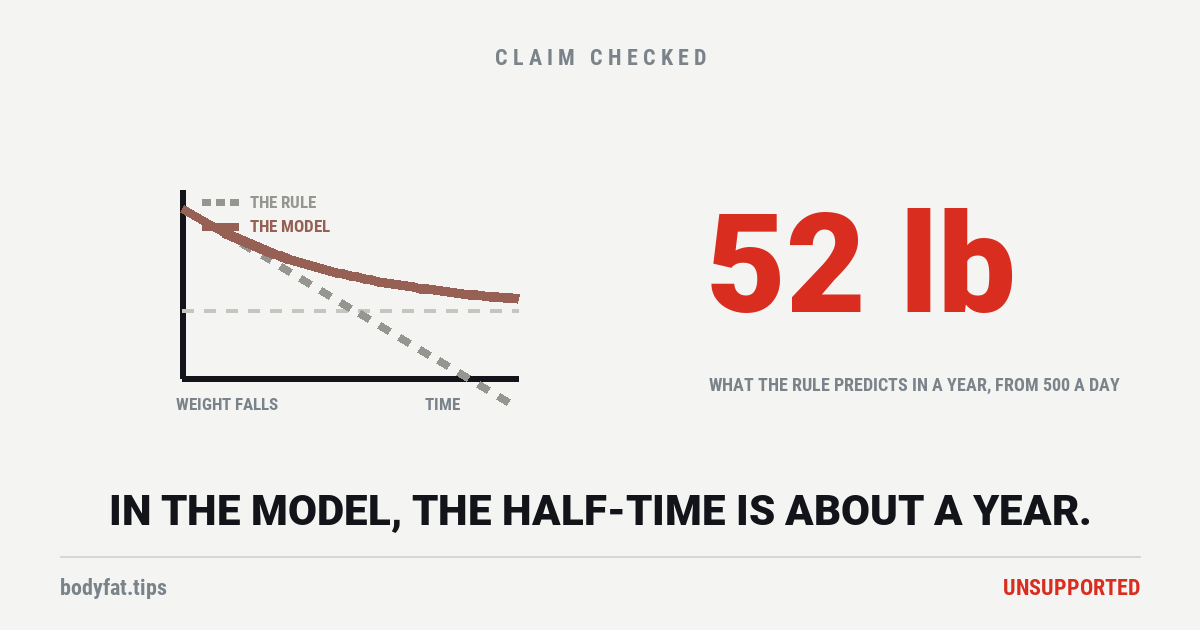
| Over one year | 182,500 calories → 52.1 lb |
| Over five years | → 260 lb, which is where the rule stops describing a person |
Nobody believes the five-year line. But the same straight line is what an app is drawing when it tells you your projected weight, and it is what people are comparing themselves against in month four, when the scale is moving slower than the line says.
Why it stops being true
A smaller body costs less to run. As you lose weight, the calories you burn each day fall — so a fixed 500-calorie cut is a smaller and smaller deficit relative to where you now are. Eventually intake and expenditure meet, and weight stops changing.
That a smaller body burns less is not in doubt. How fast it plays out is a model’s estimate. A model published in The Lancet, built to simulate how expenditure adapts during weight loss, predicts that the bodyweight response to a change of energy intake is slow, with a half-time of about one year. [1] That paper checked its weight curves against weight measured over periods of up to six months, and asked for longer studies. [1] In 2018 the same group ran the model against a two-year calorie-restriction trial: given the changes in eating the trial measured, its average weight came within about 1 lb (0.47 kg) of the measured average, though its predictions for individuals varied widely. [8] Outside that group, doctors at a Canadian hospital weight programme checked the online planner built on the model against their own patients on a 900-calorie meal-replacement diet. Over seven weeks, what 3,703 people weighed came within about 1.5% of its predictions on average [9]; after three months, 1,761 people weighed a median 4.9% less than it predicted, with wide differences from one person to the next [10]. Neither check ran longer than three months. A half-time for a cut held exactly is still a prediction, because in that trial the average cut drifted. [8]
A half-time is worth pausing on, because it is the heart of the model. It means that, if the model is right and the cut is kept, after about a year you are roughly halfway to wherever that change in intake is eventually going to settle you. Not halfway through losing weight forever — halfway to a destination that exists.
So the rule and the model do not just disagree about how many pounds. They disagree about the shape of the whole thing. One is a straight line with no end. The other is a curve that flattens.
The same model predicts something genuinely encouraging, and it gets lost: people carrying more fat eventually lose more weight for the same change in intake — more of what they lose is fat, so their expenditure falls more slowly — though the first year’s loss is similar, and they take longer to reach their new steady weight. [1] In the model, the people most often told they have the hardest job have the largest response.
The second problem: not all of a pound is fat
The 3,500 figure is the estimated calorie shortfall behind each pound of weight that obese dieters actually lost in a 1930 study, close to the roughly 3,750 calories in a pound of fat tissue. [4] But you do not lose pure fat — some of what goes is lean tissue, which holds far less energy per pound, and in the first weeks some of it is stored carbohydrate and water. [2] [4]
Working through this properly, a 2008 analysis found the rule “approximately matches” the real energy density for people carrying a lot of fat, and overestimates the deficit needed for leaner people. [2] In other words the rule is calibrated for one kind of body and applied to all of them.
The same analysis suggests this may be part of why men tend to lose more weight than women on the same deficit — women typically carry more body fat at a similar weight, and more initial fat means more energy needed per pound lost. [2] Which is worth knowing before you conclude something is wrong with you. A pound is a pound; what it is made of is the variable.
And the study everybody misuses
Fourteen contestants from The Biggest Loser were followed for six years. They had lost an average of 129 lb (58.3 kg) during a 30-week competition. Six years later they had regained about 90 lb (41.0 kg), and their resting metabolic rate was still 704 calories a day below where it started. [3]
Adjusting for how much smaller they now were and how much older, the researchers estimated a residual slowdown of 499 calories a day that body size alone did not explain, by comparing measured resting metabolism with what an equation built from the group’s own starting data predicted. [3] In these fourteen people, metabolic adaptation was real and it persisted for years. Later and larger studies, which measured people once their weight had held steady for a few weeks, found much less of it. In 171 overweight women it averaged about 54 calories a day just after weight loss, did not predict who regained, and in the 46 measured at every visit was too small to tell from zero one and two years on. [6] A review of 33 studies found it in most of them, but smaller or not significant in the better-designed ones, and weaker or absent once weight had stabilised. [7]
Now the part that gets dropped, and it reverses the usual moral. In that same paper, weight regain was not significantly correlated with metabolic adaptation at the end of the competition. [3] And the people who kept the most weight off at six years tended to have the most metabolic slowing, not the least. [3]
So “my metabolism is broken, that is why I regained” is not what this study found. A correlation of −0.1 sits next to zero, the point on the scale that means no relationship at all, and p = 0.75 is nowhere near the line researchers use for “probably not chance”. In fourteen people, it is saying nothing.
It is also fourteen people from a television show, losing weight at a rate almost nobody attempts, which is about as far from a general population as a study gets. It shows adaptation is possible and lasting. It does not tell you the size of yours.
What to do with a number that is wrong in a useful direction
Keep it as a conversion and throw it away as a forecast. As a way of sizing a change — is this a small adjustment or a large one — 3,500 per pound is fine. As a projection, it is a straight line describing a curve.
If you want a number for the year, the Lancet paper offers its own rule of thumb. For an average overweight adult, every 10 calories a day cut for good eventually takes off about a pound (100 kJ a day per kilogram, in the paper’s units); about half of that change arrives in the first year and 95% of it in about three. [1] Run a 500-calorie cut through it and you get about 50 lb in the end and roughly 25 lb in the first year, against the straight line’s 52 lb in year one; that arithmetic is ours. The paper’s own worked example is a 220 lb (100 kg) man who cuts 480 calories a day: the model has him settling near 165 lb (75 kg), while the straight line has him losing about 48 lb (22 kg) in the first year alone, which the authors call about double the model’s prediction. [1]
Those are a model’s predictions, not measurements, and they assume the cut is kept exactly. The 10-calories-a-pound slope matches energy use measured once in each of a cross-section of adults of different weights. [1] And because a person’s starting calorie needs cannot be measured to better than about 5%, and usually far worse, the paper’s own simulation of one man spreads by about 9 lb (4 kg) either way after several years, even with the cut kept. [1] The web simulator the paper describes now redirects to the NIH’s free Body Weight Planner, which runs a projection for your own numbers.
Three things follow, and they are the practical part:
— A slowing curve is the expected shape. A stop in the first few months is not. In controlled feeding studies weight comes off in almost a straight line for six months, as the model predicts, and the model’s curve takes years to flatten. Its authors judge a stop at six to eight months more likely to be the diet drifting back toward where it started than metabolism slowing. [1] So if the scale stops early, compare what you eat now with what you ate in the first weeks before concluding your body has adapted.
— Give it much longer than you think. In the model, with the cut kept, a half-time of a year means most of the change is still ahead of you when most people conclude it is not working.
— The deficit has to keep up with the smaller body. In the model, holding a lower weight means eating about 10 calories a day less than you used to for every pound you keep off, for good. [1] That is one reason maintenance is harder than losing, not the whole of it: the same paper could only reproduce the usual lose-then-regain curve by letting intake drift back up within the first year. [1]
And the levers that still work are unglamorous: protein while dieting, lifting, walking. No food has been shown to burn more than it contains, and your metabolism did not collapse at 40.
One caveat about the evidence itself. The sources this page leans on most, [1] to [3] and the model’s two-year check [8], come out of one research group at the US National Institutes of Health: the same scientist wrote one alone, was first author of another with outside co-authors, and senior author of the other two. That is normal for a specialised field and it is not a criticism of the work — but a finding resting largely on one group is a weaker thing than the same finding from four, and you should know which one you are being handed. The direction, at least, has been measured by a separate team: in seven closely supervised studies, among them fasting and semi-starvation experiments, 103 adults on deficits averaging about 1,440 calories a day lost 20.1 lb over one to three months, where the rule predicted 27.6 lb (the paper reports pounds). [5]
This page was corrected on 9 October 2026 after an independent editorial review. It called a model’s prediction a measurement: the half-time of about a year comes from a simulation published in The Lancet, and is a prediction for a calorie cut held exactly, which the page and its search description now say. Its advice on stalls had that source backwards: the model predicts weight coming off almost in a straight line for six months, and its authors judge an early stop more likely to be the diet drifting than metabolism slowing, so “a stall is the expected shape” is gone. And it said the 3,500 rule is roughly right over a week, which no source here supports; in the first weeks part of the loss is water and stored carbohydrate. The headline has changed with it.
Also changed: the 1958 paper is now described from its own text (it derived 3,500 from weight obese dieters actually lost, offered it as a predictor, and warned that expenditure falls as weight falls); the funding row, which said funding was not stated, now gives each source’s funding; the caveat about the evidence now says the page’s main sources come from one NIH research group; and the page adds a separate team’s measured comparison, the model’s own rule of thumb with its limits, the same group’s two-year check of the model, later studies of metabolic slowing at stable weight, and a published dispute over the 499-calorie estimate. A claim about other websites, and a link that promised an explanation the linked page does not give, were removed. The provenance chain’s search figure now says where it came from and when we pulled it. The page now also reports two outside checks of the model’s online planner, over seven weeks and three months. The rating is unchanged.