Free vs Total Testosterone: A Normal Number Can Hide a Low One

Most of the testosterone in your blood is probably not doing anything.
It is stuck to a protein called sex hormone-binding globulin — SHBG — which carries it around and, while it is holding on, keeps it out of your cells. Only a small slice of it floats free: 2 to 4%, by the Endocrine Society guideline’s figure [5]. On the leading theory, that unattached slice, and perhaps a loosely bound share, is what actually gets where testosterone works. A third theory has some of the SHBG-bound hormone reaching a few tissues, such as the prostate, too [2].
Your lab report leads with total testosterone: everything, bound and free, added up. Which raises an obvious question. There is a very good study that answers it, and a smaller one that disagrees.
What happens when the two numbers disagree
In 2016, researchers took 3,334 men aged 40 to 79 from a European population study and did something simple and rarely done. Instead of picking a number, they sorted every man into all four possible combinations — normal or low total, normal or low free — and then asked which group actually had symptoms. [1] “Low” meant a total under 303 ng/dL (10.5 nmol/L) and a free under about 63 pg/mL (220 pmol/L). And the free figure was calculated from each man’s blood results, not measured directly; more on what that means below. [1]
| Total / Free | Men | Symptoms? |
| normal / normal | 2,641 | reference group |
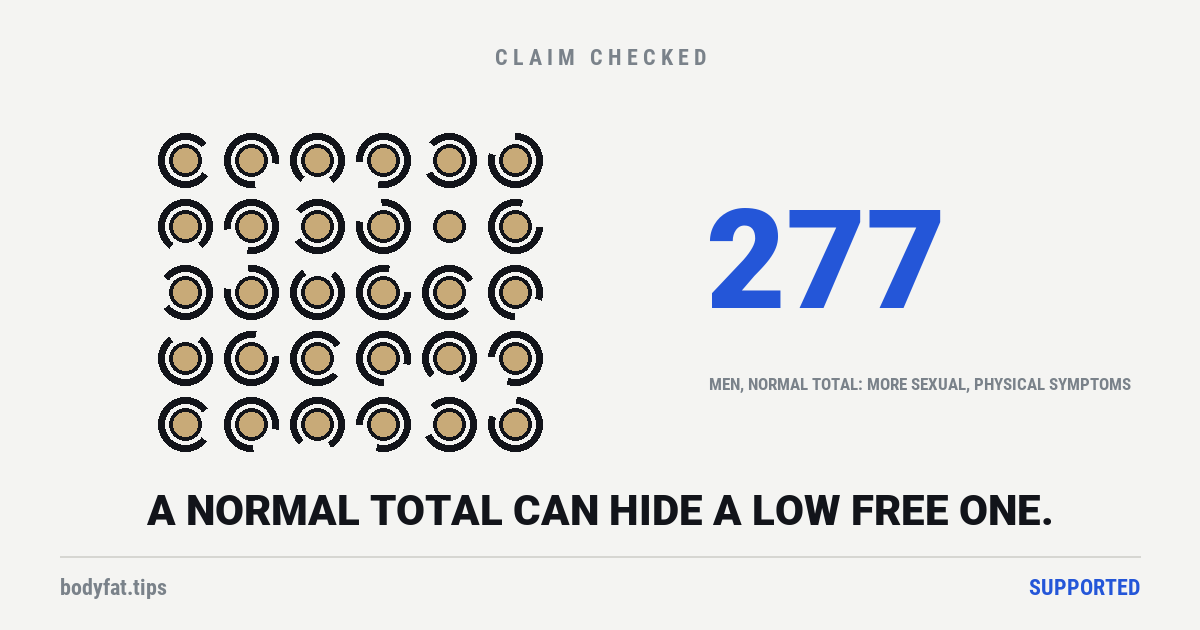
| normal / low | 277 | Yes — more sexual and physical symptoms |
| low / normal | 96 | No — “features of androgen deficiency were lacking” |
| low / low | 320 | yes |
Look at the two middle rows, because that is the entire finding.
277 men had a normal total testosterone and a low free testosterone. A total-only lab report would have called them fine. They were older, in poorer health, and they reported more sexual and physical symptoms than the reference group. Their haemoglobin, the oxygen-carrying protein in red blood cells, and their bone ultrasound readings were lower. [1]
96 men had the reverse — a low total testosterone with a normal free testosterone. A total-only report would have flagged them. In the paper’s own words, “features of androgen deficiency were lacking.” [1]
The free number tracked the sexual and physical symptoms. The total number, where the two disagreed, mostly did not. The 96 low-total men matched the reference group on every symptom the study compared but one: their morning erections came a little less often, a result sitting right on the line researchers use for “probably not chance”. [1]
Two things the free number does not explain. Haemoglobin was slightly lower in both mismatched groups, so it does not tell them apart. And neither number tracked low mood, low energy or fatigue once age, weight and illness were accounted for. [1]
The authors’ conclusion, in which cFT means calculated free testosterone and TT total testosterone: “Low cFT, even in the presence of normal TT, is associated with androgen deficiency-related symptoms. Normal cFT, despite low TT, is not associated with cognate symptoms; therefore, cFT levels should be assessed in men with suspected hypogonadal symptoms.” [1]
Why the two numbers come apart
Both discordant groups fall out of one mechanism, and you can see it in the study’s own description of them.
Ageing raises SHBG. More carrier protein means more of your testosterone is held out of circulation, so free falls while total can look untouched. That is the first group: older, higher SHBG, normal total, low free, symptoms.
Obesity lowers SHBG. Less carrier protein means less is held, so a larger share of a smaller total is available. That is the second group: younger, more obese, lower SHBG, low total, normal free, no symptoms. [1]
This is worth holding on to, because it explains a pattern that otherwise looks like noise — and the study’s own group averages make it concrete. The men with a low total and a normal free averaged 277 ng/dL (9.6 nmol/L), and had no androgen-deficiency features. The men with a normal total and a low free averaged 410 ng/dL (14.2 nmol/L) — a comfortably higher, entirely reassuring-looking number — and they were the ones with the symptoms. [1]
It also puts a caveat on something from the next piece in this series. Losing weight raises total testosterone, reliably and by a well-measured amount. Part of that rise, on our reading of the mechanism, is SHBG going back up and holding more of it — so free testosterone should rise by proportionally less. That is reasoning from the mechanism, not a measurement: none of the studies cited here puts the two side by side.
Now the awkward part: how your free testosterone was worked out
There are three ways to get a free testosterone number, and there is a good chance yours did not come from the best one.
The reference method is equilibrium dialysis — physically separating the unbound hormone through a membrane and measuring what comes through. It is accurate and it is a nuisance: “too complex for use in routine clinical laboratories,” as a 2019 review of the field puts it. [2]
Many labs therefore calculate it instead, from your total testosterone and your SHBG, using an equation. The most widely used, according to the 3,334-man study’s authors, is the Vermeulen equation, and it is the one they used for every man in that study [1]. And here is the sentence that should change how you read the result:
“The algorithms derived for calculating free T are inaccurate because they were founded on faulty models of testosterone binding to SHBG, however they can still give clinically useful results.” [2]
We are quoting the whole sentence deliberately. Stopping it at “inaccurate” would be the exact selective quotation this site exists to catch other people doing. The equations are built on a model of how testosterone sticks to SHBG that turned out to be wrong, and they are still good enough to be worth having. Both halves are true.
The third way is the one to watch for. A direct “analog” immunoassay — an antibody-based kit test that estimates free testosterone in one step — is widely offered: the Endocrine Society’s guideline says such tests are frequently available in local and some reference laboratories, and tells clinicians not to use them, because they are inaccurate [5]. The 2019 review calls the older direct analog methods discredited [2]. They are still on American test menus: Labcorp lists a free testosterone test whose method is a “direct analog enzyme immunoassay” [6]. If your report does not say how your free number was produced, ask.
Two further things from the same review are worth knowing. There are no common reference intervals for free testosterone, because the assays are not harmonised between laboratories. And the free androgen index — which some labs still report — is explicitly “not recommended for use in men”, because it goes wrong at the extremes of SHBG. [2]
The review also notes, fairly, that the whole free-hormone theory “remains controversial and it has its detractors who claim that little extra benefit is gained than simply measuring total T.” [2] That argument is live, and the detractors have data of their own. An Australian study of 1,651 men aged 70 and over sorted them the same four ways, with its own formula and cut-offs, and found the mismatch rare: 40 men had a normal total and a low free, and 38 the reverse. Across 24 health measures, sexual function among them, the mismatched men almost never differed in a way that men low on both numbers did not also show, and the authors concluded that calculated free testosterone adds “minimal independent” information, beyond the total, about who becomes ill or dies [7]. They also argue that the European link may be partly age in disguise: both numbers that go into the calculation change with age, and the 277 men were about nine and a half years older, on average, than the men they were compared with [7][1]. The review quoted above sets the two studies side by side and calls them “contradictory evidence” [2].
We still give the 3,334-man study more weight on the question this page asks, for three reasons you are free to reject. It had seven times as many men in the group that matters, 277 against 40. It covered men from 40 to 79, not only men over 70. And its models adjusted for age, which does not rule out the Australian point but should blunt it. That is a judgement, not a result, and the rating does not rest on it: the verdict below says what does.
What the numbers look like, lab by lab
In 2023 a team measured free testosterone the reference way in 145 healthy non-obese men, 69% of them White: standardized equilibrium dialysis at body temperature, undiluted serum, and what passed through the membrane measured by mass spectrometry (an instrument that identifies and counts molecules by their weight) on an assay certified by the US Centers for Disease Control and Prevention. [3]
Across all ages, the middle 95% ran from 66 to 309 pg/mL (229–1072 pmol/L), with a median of 141. For men aged 19 to 39, a group of just 61, it was 120 to 368 pg/mL (415–1274 pmol/L), median 190. [3]
Free testosterone fell with BMI, with age, and with SHBG — and the percentage that was free was lower in older men even after adjusting for their SHBG, which suggests something beyond the carrier protein is going on. The authors are careful to say these intervals “require further validation in other populations.” [3]
Now hold those numbers against a second study. In 2026 a Belgian team measured free testosterone the same reference way, dialysis followed by mass spectrometry, in 1,202 White men from large population studies. For non-obese men aged 18 to 39 its range was about 53 to 216 pg/mL (184–749 pmol/L) [8], well below the 2023 study’s 120 to 368 for men aged 19 to 39. Both samples were healthy, non-obese men, both labs used the reference method, and a man whose result read 100 pg/mL, say, would be low by one range and normal by the other.
Your lab’s range will probably differ. Given there are no harmonised intervals, that is not a scandal — it is the current state of the field, and it is a reason to compare your result to the range printed beside it rather than to a number from the internet.
What good practice looks like
The people who build these reference ranges are unambiguous about the right way to do it: total testosterone measured by mass spectrometry in a laboratory certified by an accuracy-based programme, free testosterone “ideally… measured by equilibrium dialysis method”, and “2 or more fasting samples obtained in the morning.” [4]
Note the order in the guideline. As part one covered, it asks for a fasting morning total first, confirmed by a repeat. It reaches for free testosterone only when the total sits near the limit or when something has moved your SHBG [5]. There, free testosterone is the second question, not the first.
Not everyone would wait. The 3,334-man study’s authors suggest measuring free testosterone in the first round of tests for middle-aged and older men, and for men with obesity, who have symptoms [1]. The Endocrine Society’s statement of July 2026 puts both numbers in its definition: a diagnosis needs symptoms plus “consistently low, accurately measured blood total and free testosterone,” and symptoms alone do not make one [9]. And the most usable rule we found comes from a 2023 joint statement by two British professional bodies, one for hormone specialists and one for laboratory medicine. When SHBG is inside its reference range, a calculated free testosterone “has no diagnostic value beyond total testosterone.” When SHBG is high, it may help diagnose a deficiency that a normal total hides; when SHBG is low, it may help rule one out despite a low total. They recommend checking SHBG in men with conditions likely to shift it and in men whose total is borderline [10].
The verdict
When your free and total testosterone disagree, free is the one that tracked the sexual and physical symptoms — in 3,334 men, with the models adjusted for age, weight and illness. A second study, of 1,651 men aged 70 and over, found the mismatch rare and found that free testosterone added little. So the rating, Supported, is for the headline: a normal total can hide a low free testosterone, which both studies found, and the guidelines say when to look for it. Whether the hidden low number is what drives the symptoms is contested: one large, well-built study says it tracks them, one smaller study says it adds little, and no body of replications settles it.
Practically, three things follow.
A normal total testosterone does not rule out a problem, particularly if you are older or have a condition that raises SHBG. A low total testosterone does not establish one, particularly if you are heavier and your SHBG is low. And if your free testosterone was calculated rather than measured, it came from an equation that the field’s reviewers say rests on a faulty model of how testosterone binds to SHBG and still gives clinically useful results [2], the same kind of number the 3,334-man study used [1]. If it came from a direct analog test, the guideline says not to rely on it [5].
Which is a fair summary of this entire area, really. The numbers are worth having. They are not worth more than the symptoms they are supposed to explain.
Part 3 of a series on testosterone. Earlier: whether to get tested and what normal means. Next: what actually raises it, then whether testosterone boosters do anything.
Related: normal testosterone levels by age · how to increase testosterone naturally · should you get your testosterone tested · ashwagandha benefits
This page was corrected on 18 September 2026 after an independent editorial review. It presented its central study as the only evidence on the question. It is not: a second study of 1,651 men aged 70 and over, sorted the same four ways, found the mismatch rare and concluded that calculated free testosterone adds little, and the measurement review this page quotes calls the two contradictory. The page now reports that study and says why we still give the larger one more weight. It also said free testosterone “tracked how men actually felt.” It tracked the sexual and physical symptoms; low mood, low energy and fatigue tracked neither number once age, weight and illness were accounted for, and the page, its search summary and its evidence panel now say so.
The evidence panel said the sources did not state their funding. All of them do, and the panel now reports it: the reference-range study was supported by a federal small-business grant to a company developing a commercial free-testosterone calculation, and its senior author holds equity in that company. Also corrected: the critique of free-testosterone equations came from the field’s reviewers, not from the equations’ authors, and the 3,334-man study’s own free numbers came from one of those equations; there are three ways to get a free testosterone number, not two, and the third is a direct test the guideline says not to use; the study followed its men for a median 4.3 years, not only at one time point; the 2023 reference range now sits beside a 2026 one that runs much lower; the study’s cut-offs, the share of testosterone that is free and newer guidance are added; and the series links are fixed. The rating is unchanged, Supported, and the page now says what it rates: that a normal total can hide a low free testosterone, which both studies found. Whether that hidden low number drives the symptoms is contested.