Confidence tier Supported

Evidence is consistent, with known limits.

42.6%of 225 people with white-coat hypertension in Monza, Italy, had high blood pressure at the clinic and outside it ten years later, against 18.2% of people with normal readings (2009)MOSTLYSupported

White Coat Hypertension: In Four Studies, High Blood Pressure or Pills for It Followed Roughly Twice as Often. The Death Risk Is Unsettled.
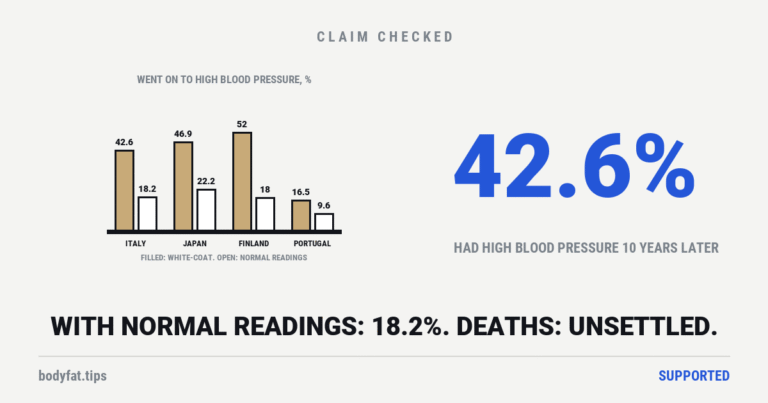
Paired bars for four cohorts, the share who went on to high blood pressure with white-coat hypertension against normal readings: Italy 42.6 and 18.2, Japan 46.9 and 22.2, Finland 52 and 18, Portugal 16.5 and 9.6; beside it the figure 42.6%

In four studies, people with white-coat hypertension went on to high blood pressure, or to pills for it, roughly twice as often as people with normal readings: 43% to 52% against 18% to 22% in three population studies. The link to heart attacks and strokes is weaker. On deaths the studies disagree, and a registry analysis behind the scariest figure was retracted. And no trial we found was designed to test pills for it.
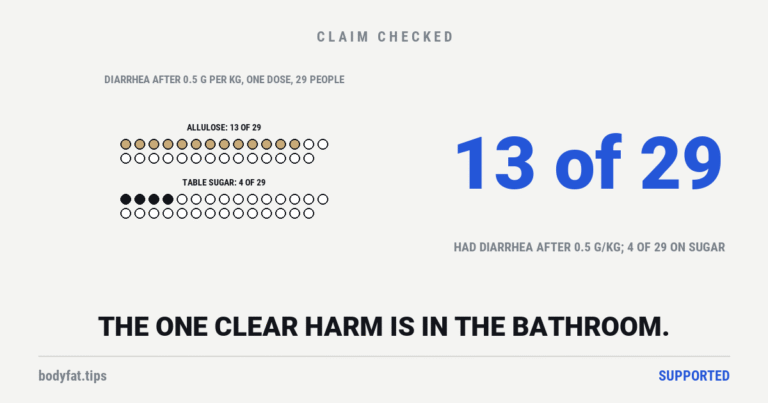
13 of 29young, lean adults who had diarrhea after one dose of allulose of 0.5 g per kilogram of body weight, about 34 g for a 150 lb (68 kg) adult by our arithmetic; 4 of the same 29 did on the same dose of table sugar, and at each dose up to 0.4 g per kilogram, 2 to 4 of 29 did on allulose and 1 to 9 on sugar (Korea, 2018)MOSTLYSupported

Is Allulose Safe? Diarrhea at Big Doses, an HDL Dip, and No EU Clearance

Two rows of 29 dots: 13 filled for the young adults who had diarrhea after one 0.5 g per kilogram dose of allulose, 4 for the same dose of table sugar; beside it the figure 13 of 29

In trials lasting up to a year, the one clear harm from allulose was the stomach: after a single dose of half a gram per kilogram of body weight, 13 of 29 young adults had diarrhea, against 4 of 29 on the same dose of table sugar. HDL, the so-called good cholesterol, fell in several trials and came back when people stopped. Europe's food-safety authority said its safety cannot be established after the applicant stopped answering; that is not a ban. Added to a sugary drink, it trimmed the blood-sugar rise by about a tenth in small trials, most of them paid for by its makers.

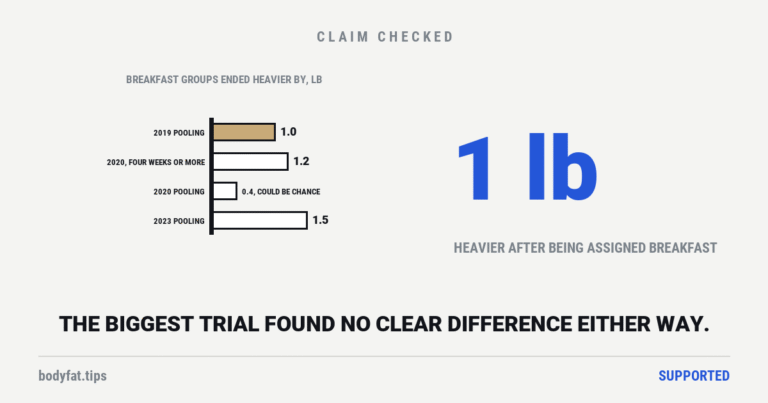
1 lbheavier, on average, after being assigned breakfast rather than told to skip it, pooled across seven trials (0.44 kg); the biggest trial found no clear differenceMOSTLYSupported

Is Breakfast the Most Important Meal of the Day? Not for Your Weight. People Assigned to Eat It Lost No More Than People Assigned to Skip It.

Bar chart of how much heavier the groups assigned breakfast ended than those told to skip it, in four poolings of the trials: 1.0, 1.2, 0.4 (which could be chance) and 1.5 lb; beside it the figure 1 lb

Assigned at random to eat or skip breakfast, adults in seven trials ended about 1 lb (0.44 kg) heavier on breakfast, and in nine trials ate about 260 calories a day more. The biggest trial found no clear difference either way. Skipping is no weight-loss trick either, and we found no trial that has counted what it does to diabetes or heart disease.

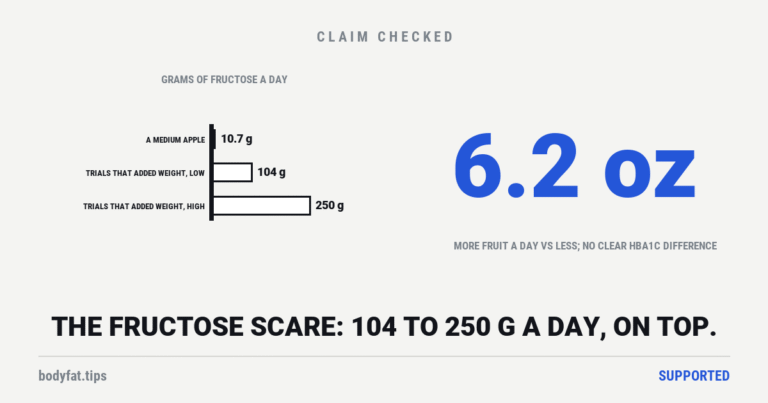
6.2 ozmore fruit a day (175 g) eaten by people with type 2 diabetes told to eat more than by those told to eat less; no clear difference in HbA1c or weight after 12 weeks (63 adults, Denmark)MOSTLYSupported

Is Fruit Sugar Bad for You? Told to Eat More Fruit or Less, People With Type 2 Diabetes Showed No Clear Difference in Blood Sugar.

Bar chart of grams of fructose a day: a medium apple about 10.7, and 104 to 250 added on top of the diet in the trials where fructose put weight on; beside it the figure 6.2 oz

In a Danish trial, 63 people with type 2 diabetes were told to eat more fruit or less for 12 weeks; their long-term blood sugar fell in both groups, with no clear difference. In pooled feeding trials, fruit did not clearly add weight. The overfeeding trials behind the fructose scare gave 104 to 250 g of fructose a day. Juice is a separate question.

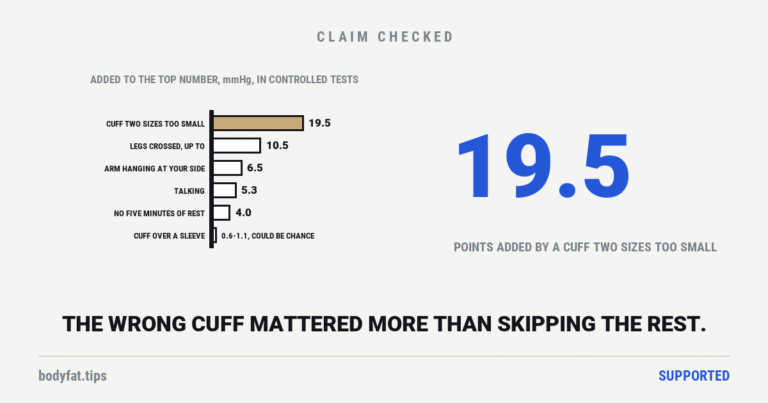
19.5 mmHgadded to the top number by a regular cuff on arms that needed an extra-large one (40 adults, measured both ways in random order, 2023)MOSTLYSupported

How to Measure Blood Pressure at Home: A Cuff Two Sizes Too Small Added 19.5 Points. Skipping the Five-Minute Rest Added Less.

Bar chart of what each measuring mistake added to the top blood-pressure number in controlled tests: a cuff two sizes too small 19.5 mmHg, legs crossed up to 10.5, an arm hanging at the side 6.5, talking 5.3, no five minutes of rest 4.0, a cuff over a sleeve 0.6 to 1.1, which could be chance; beside it the figure 19.5

In randomised trials, a regular cuff on arms that needed an extra-large one read the top number 19.5 points high, and an arm hanging at the side 6.5. Crossed legs, talking and caffeine push it up too, and so, by less, does skipping the five-minute rest. Wrist monitors miss more often at home, and most sold online are on no validated list.

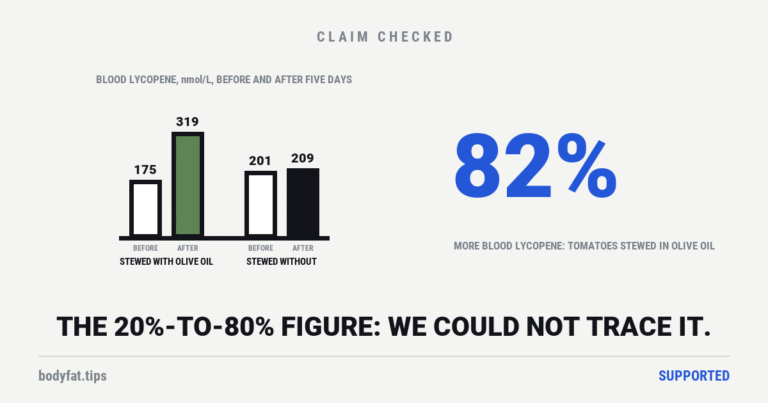
82%rise in the main form of lycopene in the blood after five days of tomatoes stewed in olive oil; no clear change in those stewed without (23 adults, 2005)MOSTLYSupported

Lycopene Benefits: Cook Tomatoes With Oil and More Gets Into Your Blood. In Seven Trials, Tomatoes Didn’t Clearly Move the Scale.

Cartoon bar chart of blood lycopene before and after five days: tomatoes stewed with olive oil 175 then 319; stewed without 201 then 209; beside it the figure 82%

Tomatoes stewed with olive oil raised the main form of lycopene in the blood by 82% in five days; stewed without, it barely moved. That half of the advice holds up. The 20%-to-80% figure is not one we could trace, tomato trials made no clear dent in body weight, and the 55% stroke figure describes blood levels in 1,031 Finnish men.

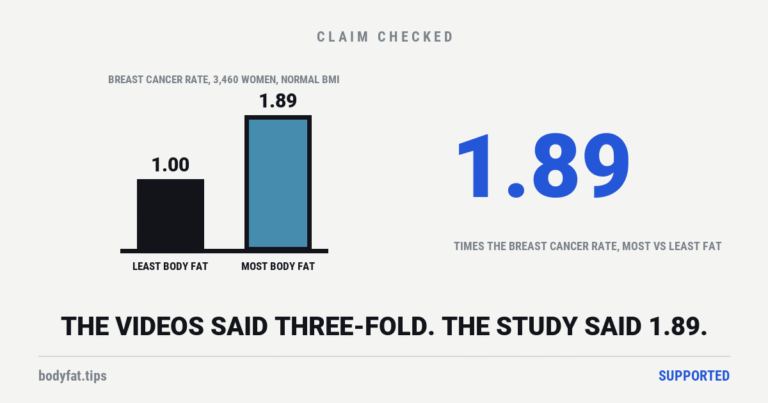
1.89times the breast cancer rate, most vs least body fat, in 3,460 women with a normal BMI; the videos said three-foldMOSTLYSupported

Is Skinny Fat Dangerous? At a Normal Weight, a Large Waist Went With More Deaths. The Study That Best Fits the ‘Three-Fold’ Claim Found 1.9.

Cartoon bar chart from one baseline: a bar at 1.00 marked least body fat and a taller bar at 1.89 marked most body fat, 3,460 women past menopause with a normal BMI; beside the figure 1.89

At a normal weight, a large waist went with higher death rates in big studies; a high body-fat reading did so less consistently. The breast cancer study that best fits the videos' "three-fold" found 1.9 times. Small trials moved the fat; none counted the deaths.

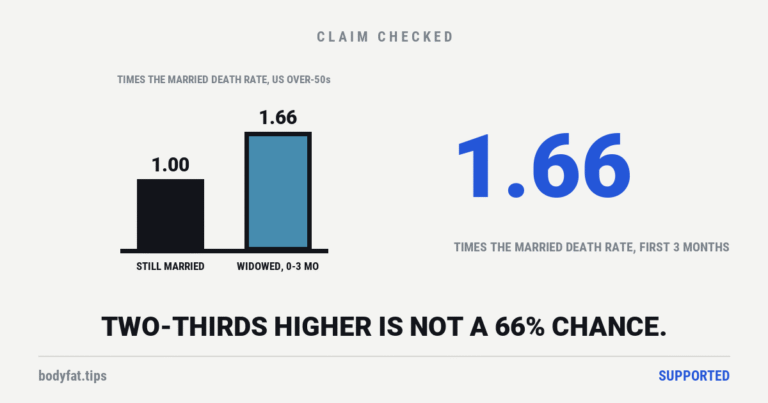
1.66times the married death rate in the first 3 months after a spouse died (US, over-50s); not clearly raised from 3 to 12 monthsMOSTLYSupported

Can You Die of a Broken Heart? After a Spouse Dies, the Survivor’s Death Rate Runs About Two-Thirds Higher for Three Months. Then the Excess Shrinks.

Cartoon bar chart: a bar at 1.00 marked still married and a taller bar at 1.66 marked widowed, first three months; beside the figure 1.66

After a spouse dies, the survivor's death rate ran about two-thirds higher for three months: against the still-married in an American study, and against people's own usual rate in a British one. Then the excess shrank, and in plain numbers it is small. Broken heart syndrome is real; when a painful emotion set it off, grief among them, about 1 in 100 patients died in hospital.

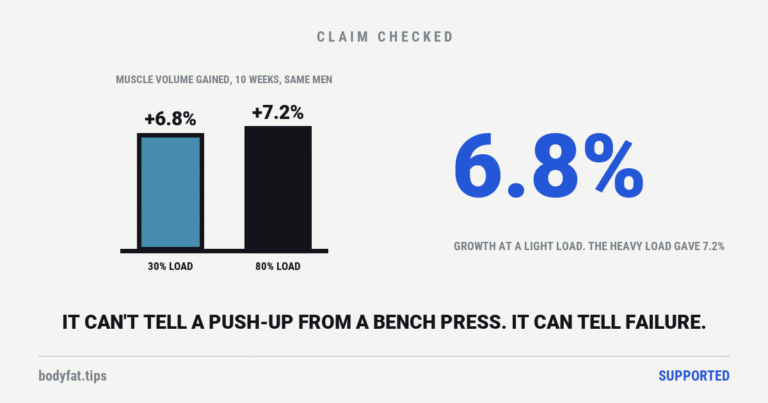
6.8%muscle gained by the leg trained at a light load; the heavy leg gained 7.2%MOSTLYSupported

Does Calisthenics Build Muscle? The Light-Load Leg Grew 6.8%, the Heavy-Load Leg 7.2%. Muscle Can’t Tell What It’s Lifting, Only How Close to Failure You Got.

Cartoon bar chart: two bars of almost equal height, plus 6.8 percent marked 30% load and plus 7.2 percent marked 80% load; beside the figure 6.8%

Muscle growth was the same at light and heavy loads across 28 trials, as long as sets went near failure. Push-ups matched a bench press in three more. The catch is not the equipment. It is where bodyweight runs out of ways to get harder.

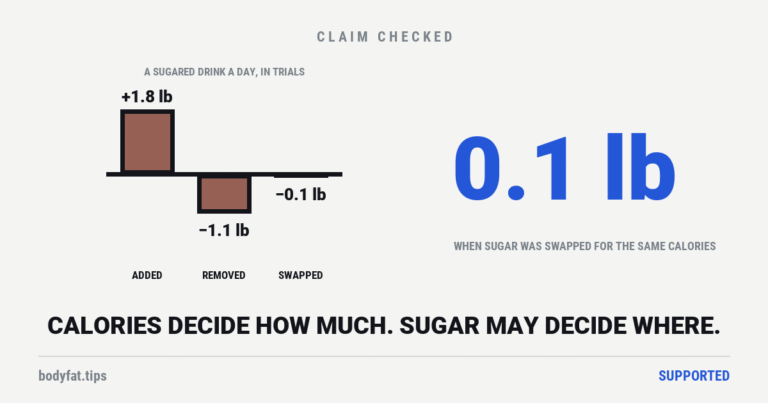
0.1 lbthe weight change when sugar was swapped for the same calories of other carbsMOSTLYSupported

The No-Sugar Diet: Cutting Sugar Lost 1.8 lb in the Trials Pooled for the WHO. Swapping It for the Same Calories Changed Nothing. The Sugar Was Never the Point.

Cartoon bar chart from one zero line: a bar rising to plus 1.8 lb marked added, a bar dropping to minus 1.1 lb marked removed, and a near-invisible bar at minus 0.1 lb marked swapped; beside the figure 0.1 lb

Cut sugar and eat freely, and the trials show about 1.8 lb gone. Swap it for the same calories of other carbs and the scale does not move. What a no-sugar diet actually is, and why the detox has nothing to detox.