How to Calculate Max Heart Rate: 220 Minus Age Missed 70 of 230 Adults by Over 10 Beats in One Lab (Our Count)

Here is the answer you searched for, in one line. The best-known formula for your maximum heart rate is 220 minus your age, so a 40-year-old gets 180 beats a minute [1]. A newer one, 208 minus 0.7 times your age, also gives 180 at 40 and parts company with it from there [2].
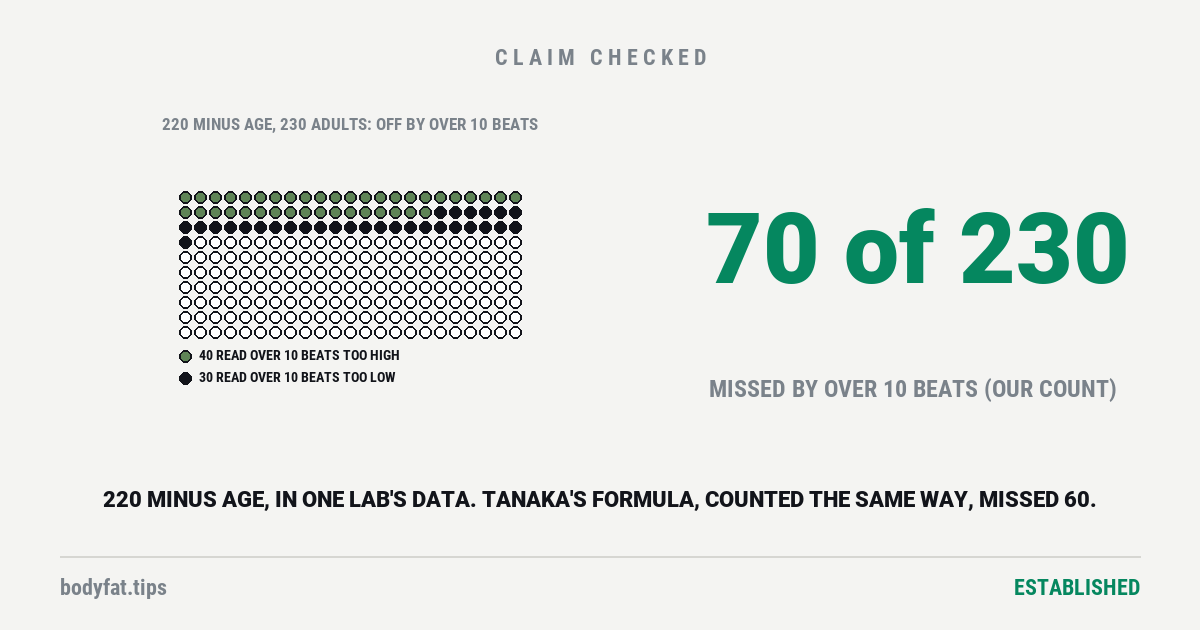
Here is what neither one can give you: your number. A university lab in Virginia published the measured maximum of 230 adults who ran to exhaustion on a treadmill, mostly recreational athletes and three in four of them men, along with what seven formulas predicted for each of them [3]. We counted. 220 minus age missed 70 of 230 adults by more than 10 beats a minute. Tanaka’s formula, the one usually offered as its better replacement, missed 60. The counts are ours, from the authors’ own data file. 220 minus age always gives a whole number of beats, so we rounded Tanaka’s estimate to a whole beat too, as a chart or a watch shows it, and counted both formulas the same way; unrounded, Tanaka’s formula misses 65: five of its estimates sit between 10 and 10.5 beats off, which a whole-beat reading rounds to 10. The paper’s published averages match ours to within a tenth of a beat.
That is the whole story in small. An age formula describes people your age. It does not describe you. The rest of this page is about how far off it tends to be, who it misses most, whether the newer formulas fix it (on average, a little; for you, barely), and how to find the real number if you need it.
How to calculate max heart rate: the formulas, side by side
The question that brought you here is searched on Google about 5,400 times a month in the US, and “max heart rate formula” another 1,300 times (from a paid keyword database, pulled 10 October 2026) [4]. In July 2025 a physicians’ explainer channel run by two orthopaedic surgeons, with guest specialists, answered it with a video called “Doctors Explain the Real Max Heart Rate Formula”, seen 380,400 times by 10 October 2026 [5]. Its description promises “four science-backed methods”: the classic formula “and its limitations”, the Tanaka formula “used for over 40s”, the Nes formula, and a hospital treadmill test called the Bruce protocol [5]. We read the description, not the video.
Here is what the formulas say at four ages, with the one a large study built for women:
| Age | 220 − age (1971) | Tanaka: 208 − 0.7 × age (2001) | Nes: 211 − 0.64 × age (2013) | Gulati, women: 206 − 0.88 × age (2010) |
|---|---|---|---|---|
| 30 | 190 | 187 | 191.8 | Not in the study (women 35 and over) |
| 45 | 175 | 176.5 | 182.2 | 166.4 |
| 60 | 160 | 166 | 172.6 | 153.2 |
| 75 | 145 | 155.5 | 163 | 140 |
Two things jump out. The formulas agree in the middle of life and drift apart at the ends: at 75 they span 23 beats, from 140 by the women’s formula to 163 by Nes’s. And, as the next section shows, the gap between formulas is smaller than the gap between people, which is the part a table like this one cannot show.
Is 220 minus your age accurate?
On average, for a mixed group of healthy adults, roughly. For any one person, no, and the studies have been saying so in nearly the same number for decades.
The cleanest test is the largest one that checked people had truly hit their limit. The FRIEND registry gathered 4,796 treadmill tests on healthy US adults, each confirmed as maximal by analysing the air they breathed out [10]. Its own age formula, 209.3 minus 0.72 times age, was right on average to within a third of a beat when tried on 1,000 people it had not been built from [10]. Its limits of agreement, the band that should hold 95 of every 100 people’s measured maximum around the formula’s estimate, ran from about 25 beats below the estimate to about 25 above [10]. That is a spread across people, not a range for you: it says how scattered the measured maximums were, not where yours sits.
The other large studies land in the same place. Statisticians call the typical miss the standard error of the estimate: roughly, the distance by which a person’s measured maximum tends to sit from the line. It was 10.8 beats in 3,320 healthy Norwegians [7], 11.4 to 12.4 in 762 sedentary adults tested twice on a bike in the HERITAGE study [11] and 11.35 in the FRIEND registry [10], and the spread around the line was 11.8 in 5,437 women in the Chicago area [8]. In HERITAGE, 220 minus age was 1.8 beats too high on average, and missed individuals by anything from 49 beats too high to 43 too low [11].
Put a number on “missed”. In the Virginia lab’s 230 adults, 220 minus age was more than 10 beats off for 70 people, 40 of them too high and 30 too low, and more than 15 beats off for 30 [3]. Those are our counts from the published data. The larger studies’ spreads, if they follow the usual bell curve, imply that between about a third and four in ten people sit more than 10 beats from the line. That is our arithmetic, not a count.
Why can’t a formula do better? Because it knows one thing about you. In HERITAGE, the age formulas accounted for about 36% of the differences in measured maximum between people [11]; in the Virginia lab, about 40 to 45% [3]. HERITAGE studied families, and its authors estimate that up to 39 to 44% of the variation is inherited [11]. A formula that knows only your age gives every 50-year-old the same answer. The 50-year-olds do not have the same answer.
There is also a tilt. 220 minus age reads too high for young adults and too low for older ones, crossing Tanaka’s and Gellish’s formulas at about 40 [2] [9]. By 70 the average gap is about 10 beats, and the 2001 authors calculate that for some older adults the formula could undershoot by more than 20 [2]. The Virginia data show the same tilt: under 40, 220 minus age read 4.3 beats high on average; from 40 to 68, 3.1 beats low (our arithmetic from the published data) [3].
Where 220 minus age came from
It was not worked out from data, say the physiologists who went back to the source. In 1971 three researchers writing a long review of physical activity and heart disease plotted about 35 data points on maximum heart rate and age, gathered from roughly ten studies, and fitted no regression line to them [6] [12]. The figure’s legend says no single line represents the data, and that 220 minus age describes a line “not far from many of the data points” [12]. It was meant as a rough guide [9]. The people in those studies were all men, most of them under 55 [9], and the studies probably included people with heart disease, smokers or people on heart medicines [2].
In 2002 two exercise physiologists did the obvious thing: they reproduced the 1971 points from the figure and fitted a line. It came out as 215.4 minus 0.91 times age, with a typical miss of 21 beats [12]. Even the original data do not quite give the formula. They also checked 18 exercise-science textbooks: 13 printed 220 minus age without citing anything, and none cited the 1971 review [12]. Their verdict was that the formula “has no scientific merit” [12].
It is still the first answer most people see. The American Heart Association’s chart says your maximum is “about 220 minus your age” [1]; the US government’s medical encyclopedia says to “subtract your age from 220” [13]; and Google’s AI answer to this search lists it first, as the “Standard Formula”, before citing the video for Tanaka’s [4]. Even the bare phrase “220 minus age” is searched about 170 times a month (from a paid keyword database, pulled 10 October 2026) [4]. None of this is a mark against anyone who has trained by it. It is printed by a heart charity and a government encyclopedia. The trouble is that it gets read as a fact about you.
The replacement came from doing the work properly. In 2001 a Colorado team pooled the average maximum heart rate of 492 groups in 351 studies, 18,712 healthy, non-smoking, unmedicated people, and got 208 minus 0.7 times age; then they tested 514 healthy adults aged 18 to 81 in their own lab, checking that each had reached a true maximum, and got 209 minus 0.7 times age [2]. A 25-year record of 132 people at a Michigan university fitness centre, tested again and again, gave 207 minus 0.7 times age [9], and the FRIEND registry 209.3 minus 0.72 times age [10]. Three methods, one line.
Is the Tanaka or Nes formula better?
Better at what? Two different questions hide in “better”, and the evidence answers them differently.
Better on average: yes, Tanaka’s, most of all as you get older. It removes the tilt. In HERITAGE it was right on average to within 0.03 beats, where 220 minus age was 1.8 beats too high [11]. In the Virginia lab its average miss was 7.40 beats against 8.44 [3]. The video’s “for over 40s” has a basis: the two formulas agree at 40 and the difference grows after it [2]. But in the Virginia data Tanaka’s formula was closer under 40 too: its average reading sat about 3 beats nearer the measured average, and its average miss was about a beat smaller, 6.8 against 7.9 (our arithmetic) [3]. And the result is not universal. In 4,043 running tests at a sports diagnostic centre in Poland, 220 minus age was right on average to within 0.2 beats, where Tanaka’s read 1.5 beats low, though Tanaka’s typical miss there was smaller, 9.2 beats against 9.8 [14], and in the Virginia lab the error of 220 minus age drifted least of the seven formulas [3]. All seven read too high for people whose real maximum was low and too low for people whose real maximum was high: 220 minus age by about a third of a beat for every beat, Tanaka’s by about half a beat, on the paper’s own charts and by our arithmetic from its data. (The paper’s table says 220 minus age did not drift at all; its chart for that formula shows the smaller drift.) That comes from its steeper line spreading its estimates about as widely as people’s real maximums spread, not from a closer fit: its average miss was still larger than Tanaka’s [3]. The same lab’s earlier study, of 99 adults averaging 38, put both formulas within half a beat of the measured average, 220 minus age 0.15 high and Tanaka’s 0.39 low, and its authors concluded that 220 minus age “may represent the best option for a general population”, though its typical miss there, 11.65 beats, was larger than Tanaka’s 10.74 [15].
Better for you: barely. Every one of these formulas is a straight line drawn from age alone, so every one has the same blind spot. In HERITAGE the typical miss was 11.4 beats for Tanaka’s formula and 12.4 for 220 minus age [11]. In the Virginia data, counted the same way, Tanaka’s formula missed 60 people by more than 10 beats where 220 minus age missed 70 (our count) [3]. Ten people in 230. By more than 15 beats, it was 22 against 30.
You will meet a bolder claim in fitness circles. A 2019 study published by a fitness-certification body tells trainers that 220 minus age has a standard deviation of 10 to 12 beats while Gellish’s 2007 formula has one of 5 to 8 [16]. The 5 to 8 comes from a sentence in the 2007 paper describing confidence-interval bounds around its line for people aged roughly 30 to 75 [9]. On our reading that is not the scatter of individual people around the line, which is what the 10 to 12 for 220 minus age describes. Put head to head on the same 230 people, Gellish’s average miss was 7.45 beats and 220 minus age’s 8.44 [3].
And Nes’s formula? It was built on 3,320 healthy Norwegians, and fitted them with a typical miss of 10.8 beats [7]. On the Virginia lab’s 230 adults it read about 6 beats too high on average [3] and, by our count, missed 79 of them by more than 10 beats (82 unrounded), the most of the seven formulas tested there. In an earlier study from the same Virginia lab, 99 treadmill tests, it read about 5 beats high on average [15], and in the 4,043 Polish running tests about 3.6 high [14]. A formula fits the people it was drawn from best.
Who the formulas miss most
The averages hide the people the formulas fit worst. Each row below is a different study, which matters for how you read it.
| Who | What the study found | Source |
|---|---|---|
| Healthy adults over about 60 | 220 minus age reads low: about 10 beats at 70 on average and 10 to 12 at 75; the 2001 authors calculate it could undershoot by more than 20 for some; in Norway’s HUNT study, earlier formulas read low on average in every age group over 30 [7] | [2] [9] |
| Adults averaging about 62, at low and high risk of heart disease | Every formula tested tended to read high; typical miss 10.4 to 12.3 beats; least accurate with low fitness, obesity, diabetes or high blood pressure | [17] |
| Adults under 40 | 220 minus age reads a few beats high: 4.3 on average in one lab’s 135 adults under 40 (our arithmetic from its data); Tanaka’s formula 1.2 | [3] |
| Women | In 5,437 women, average peak heart rate sat below 220 minus age at every age studied, by about 9 beats at 45 and 5 at 75 (206 − 0.88 × age; the gaps are our arithmetic), on a test with no breathing-gas check of maximal effort; HERITAGE found 220 minus age read about 3 beats high for women, while Tanaka’s line, the same for both sexes, was within a beat of their average; four studies that checked for a maximal effort found that knowing a person’s sex did not improve the prediction, and one of them, Norway’s HUNT, found women’s maximums higher than earlier studies had reported; tried on 32 women in an earlier study from the Virginia lab, the women’s formula read about 8 beats low | [8] [11] [2] [10] [7] [3] [15] |
| Black adults | In HERITAGE, both formulas read high on average and missed more widely: a typical miss of 13.1 to 14.4 beats, against 10.2 to 11.0 for white participants | [11] |
| Endurance athletes | In 4,043 running tests, 220 minus age was right on average to within 0.2 beats; in 4,375 athletes’ self-reported maximums, the formulas read about 5 to 6 beats low | [14] [18] |
| Children and teenagers | Across seven studies, 220 minus age read 12.4 beats high on average and Tanaka’s formula 2.7 low; the 2002 history says adult formulas should not be used at 10 or under | [19] [12] |
| People taking beta-blockers | In 166 heart patients, measured maximum averaged 133 against 161 by 220 minus age; a formula built for them, 164 − 0.7 × age, still had a typical miss of 18 beats | [20] [21] |
Two rows deserve a sentence each. The women’s formula is a real finding from a large study, but its test stopped when each woman chose to stop, with no breathing-gas check that the effort was truly maximal [8]. Four studies that did check found that knowing a person’s sex did not improve the prediction [2] [10] [7] [3], and Norway’s HUNT found women’s maximums higher than earlier studies had reported [7]. HERITAGE, which also checked, found 220 minus age read about 3 beats high for women, but Tanaka’s line, the same for men and women, within a beat of their average [11]. And when an earlier study from the Virginia lab tried the women’s formula on 32 women, it read about 8 beats low on average, a gap the authors found statistically significant [15]. One large study for a separate women’s line, then, and the studies that checked the effort against it. The beta-blocker row is not in doubt at all. These medicines slow the heart at every effort, and in that study 84% of patients told to train at 85% of 220 minus age would have been working above the top of the guideline range set from their own measured maximum [20].
Is your max heart rate higher if you’re fitter?
Mostly no, and if training moves it at all, it seems to nudge it down. The 2001 pooling found no clear difference between the lines for sedentary, active and endurance-trained adults, and neither did its lab study [2]. The Norwegian study found no sign that fitness changed the line, and only minor differences between fitness groups [7]. A 2000 review of training studies found maximum heart rate tends to fall a little with endurance training and rise again when people stop, an effect size of about 0.5 each way. On the scale where 0.2 is small and 0.8 large, that is a moderate shift; the author put it at 3 to 7% and asked readers to treat it cautiously [22].
There is one twist, with age. At a university fitness programme in Indiana, among 3,318 adults, peak heart rate fell by about 0.6 beats per year of age in the fittest group and about 0.9 in the least fit, and the 643 people tested more than once showed the same pattern, 0.6 against 1.0 [23]. So a fit 65-year-old may keep a higher maximum than an unfit one of the same age. One cohort, observational, and read as its abstract: a lead, not a rule. Two other studies point the other way: the 2001 pooling found the line did not differ with habitual activity, and HUNT found no sign that activity or fitness changed how maximum heart rate fell with age [2] [7].
So “how to calculate max heart rate for athletes”, one of the searches beside this one, gets the same answer as everyone else’s. Across 13 formulas, the typical miss for the Polish centre’s runners and cyclists was 9.1 to 10.5 beats [14], about what it is for anyone else, and the only way to know an athlete’s maximum is to measure it.
Is a 170 heart rate bad when running?
Not by itself. It depends on whose heart it is, and a formula cannot tell you that.
For the 4,043 runners at the Polish centre, average age 34 and mostly men, measured maximum averaged 185 beats a minute [14]; 170 is about 92% of that (our arithmetic), a hard effort but not a limit. For a 60-year-old, the heart charity’s chart puts the maximum at 160 [1], so 170 looks impossible. It is not. Tanaka’s line puts the average healthy 60-year-old at 166 (our arithmetic from the formula), and the typical miss around such a line is 10 to 12 beats either way [2] [10]; a quarter of the 5,437 Chicago-area women went past 100% of their 220-minus-age figure [8]; and of 18,961 people without heart disease given treadmill tests at one large US clinic, 2,917 reached 105% or more of their age-predicted peak [24].
Going past the predicted number did not mark people out for trouble in that clinic. It went with better fitness and a somewhat lower death rate afterwards, after adjusting for heart risk factors: a hazard ratio of 0.83, meaning a death rate about 17% lower, with the range the true answer probably sits in running from 0.70 to 0.99 [24]. That is an association in patients sent for testing, not proof that a higher number protects anyone.
What matters more than the number is how you feel. Chest pain or pressure, fainting or nearly fainting, or breathlessness out of proportion to the effort are reasons to stop and see a clinician, whatever your wrist says. That is our advice, ordinary medical caution, not a finding from these studies.
What is a good max heart rate by age?
There isn’t a good one. A maximum heart rate is not a fitness score: it falls with age whether you train or not [2] [9], and training does not raise it [22]. At any age healthy people spread across a band about 50 beats wide [10], so a number near either edge of a chart is not, by itself, a verdict on your heart. The chart this search turns up, from the American Heart Association, is 220 minus age, 200 at 20 down to 150 at 70, and it says itself that the figures are averages to use as a general guide [1].
Where a low maximum does mean something is in a clinic. If your heart rate will not climb toward the expected range during a supervised all-out test, doctors call it chronotropic incompetence. In the Chicago-area women, each extra beat of peak heart rate went with a 3% lower risk of death over the next 16 years or so, after adjusting for fitness and risk factors. Failing to reach 85% of the age-predicted figure was not an independent predictor of death in that study; being well below the women’s own average for their age was [8]. That is a test result read by a clinician, not a number to chase.
Heart-rate zones inherit the miss
The zones on the heart charity’s chart, in the watch maker’s guide and in gyms that build classes around heart-rate zones are percentages of a maximum [1] [25] [16]. If the maximum is an age estimate, the zone carries its error. Our zone 2 verdict found that even with each rider’s maximum measured in a lab, a fixed percentage of it matched the intended intensity on average and missed rider by rider; that page says starting from an age estimate adds a second source of error on top, and labels that as its own reasoning.
How much does it matter in practice? Less than you might fear for a young, healthy exerciser, and more for others. In the certification body’s study, 26 adults aged 18 to 25 exercised in zones set from an age formula, with the treadmill’s speed and incline adjusted to hold each target heart rate; checked against zones worked out from their measured maximum, the reading sat in the intended zone 150 times in 182, 82%, by the body’s own write-up, and was otherwise one zone off [16]. The study’s journal version gives 156 in 182, 86%, and does not mention the body [26]. But their measured maximums were bunched tightly, a standard deviation (the typical distance from the group’s average) of 6.6 beats [16], narrower than the spread of 11 or 12 around the age line that the large studies find [10] [11]. In heart patients on beta-blockers the same approach mostly failed [20]. The Virginia lab’s authors write that their formulas’ errors could move a person across two training zones [3].
Watch estimates of fitness lean on an assumed maximum too, as our verdicts on VO2 max tests and improving VO2 max describe. And the “fat-burning zone” printed on cardio machines is a band of a maximum as well; our jogging verdict covers where it came from.
If every formula misses about as many people, why does anyone argue about which one is best?
This section is the desk’s own reasoning, and it is labelled as such. The studies above settle that age formulas are rough. They leave open why the argument over which formula persists, in videos, calculators and AI answers, when the choice moves the miss by a beat or so for most people. Here are three answers, each rated.
Answer one: because on average the formulas really do differ, and the difference grows with age. At 75, 220 minus age says 145 and Nes’s formula says 163 (the table above, our arithmetic from the published formulas). For an older reader that is a real difference in where a zone sits. Which line matches healthy older adults on average depends on where they were measured: in the US, the 2001 lab study, the Michigan record and the FRIEND registry all landed within about a beat of Tanaka’s line [2] [9] [10]; in Norway, HUNT found healthy older adults’ maximums higher than earlier formulas gave [7], and its line sits about 7 beats above Tanaka’s at 60 and 7.5 at 75 (our arithmetic from the two formulas). Measured, for the averages. Why the two countries’ lines differ, these studies did not test.
Answer two: because zones are wide enough that the miss often does not show. A zone 10% of a maximum wide was 17 beats for one 21-year-old in the sponsored study, and a 10-beat miss inside it usually leaves you one zone off, which is what that study found in young adults [16]. So the formula feels as if it works, and arguing over the refinement feels worthwhile. That the miss hides less well in older, less fit or medicated people is a surmise, from the wider spread HERITAGE found in the half of its participants older than about 30 and in its less fit half [11] and from the beta-blocker study [20].
Answer three: because the devices need a number to start from. A watch that sets zones as percentages of a maximum needs that maximum before it has measured one. One watch maker’s guide calls 220 minus age “a good starting point” and sells a running test that asks you to reach at least 85% of the maximum it is trying to find [25]. This is an observation about how the product works, not a finding from a trial.
Put the three together and here is what we think is true, stated plainly so you can disagree with it: your maximum heart rate is a measurement, not a calculation; a formula describes people your age, and the fight over which formula is a fight over a few beats inside a band 36 to 50 beats wide. (The band is the width of the limits of agreement in the FRIEND registry, about 50 beats, and in the Virginia lab, about 36 to 40 for its formulas: our arithmetic [10] [3]. An earlier study from the Virginia lab printed bands of about 42 to 46 for the four formulas nearest on average [15], and athletes’ own reports of their highest heart rate gave narrower ones, about 28 to 29 [18].)
What we could not find, and would like to: a randomised trial that set one group’s training zones from a measured maximum and another’s from an age formula, then measured who got fitter. We searched PubMed in two wordings, the wider class of trials comparing ways of setting exercise intensity, the US trials registry and an ordinary web search, and did not find one. The nearest we found are of two kinds, and we name examples rather than every trial. The first kind compares zones built on breathing or blood-lactate thresholds with zones built on percentages of a heart rate, everyone given a lab test first. In one, in 42 sedentary adults and funded by the same certification body, the threshold zones gave more than twice the gain in VO2 max (the most oxygen your body can use), 3.93 against 1.76 millilitres per kilogram per minute (the comparison is ours) [27]; a later trial sharing its senior author, in 39 adults, counted everyone on threshold zones as a responder (improved by more than the test’s own error) against 60% on heart-rate zones [28]; but in 75 adults with metabolic syndrome, interval training set from a percentage of maximum heart rate or from a lactate threshold raised VO2 max by almost the same amount, 3.6 and 3.7 [29]. The second kind sets cardiac-rehab training by feel or by a heart-rate target range taken from a measured test. A pilot at one US hospital that randomised 48 people, 24 of whom finished before the COVID-19 pandemic cut it short, too small to settle it, saw exercise capacity rise by 1.0 MET (a MET is the energy you burn at rest) with training by feel, against 1.9 and 2.0 with heart-rate targets, a gap that could still be chance [30]; its lead investigator now runs a registered trial of 320 cardiac-rehab patients aged 60 and over that compares zones from a measured test with training by feel, its main results due by its own estimate in late October 2026 and none posted yet [31]. The video says guessing your maximum “could be holding your fitness back” [5]; the trial we could not find is the one that would show it. If you know of one, the corrections line on this site is open.
How to find your real maximum, and who should not try
Measure it. A maximal exercise test, on a treadmill or a bike, raises the effort step by step until you cannot go on, with your heart rate recorded throughout; the best versions add a mask that analyses your breath, which is how the studies above checked that people had truly reached their limit [2] [10]. The Bruce protocol in the video is one such hospital treadmill test, used in the Chicago-area women’s study [8]. Even a measured maximum wobbles: in HERITAGE, retesting the same people gave a day-to-day spread of about 5 beats [11].
A hard race or an all-out hill climb gives a field reading. In 4,375 endurance athletes who reported their own highest reading, those numbers sat about 5 to 6 beats above the formulas on average [18]; the reports were not checked. One watch maker’s guide suggests a three-climb hill test and, after the second climb, adding “approximately 10 beats” to the highest reading [25]. The guide cites no study for the ten beats, and Google’s AI answer, citing that guide, moves the ten beats onto the final sprint [4].
Who should not try this alone: anyone with heart disease, anyone who has had chest pain or pressure with exertion, anyone who has fainted or nearly fainted, and anyone taking a medicine that slows the heart, beta-blockers above all. For you a maximal test is a clinical test, done with a clinician, and your training zones belong in that conversation too [20]. The heart charity’s chart says the same about medicines [1].
If you do not need the exact number, you may not need a number at all. Several of the papers on this page point people without a measured maximum to how hard the effort feels, called perceived exertion, or to the talk test [2] [9] [20] [3]. Our zone 2 verdict explains the talk test.
What this is rated, and what the rating covers
Established — for the claim that an age formula gives only a rough estimate of a healthy adult’s maximum heart rate: close to the average of a mixed group of healthy adults, and off by more than 10 beats a minute for a large share of them, whichever formula is used.
It is rated Established because the same spread turns up wherever it has been measured: a typical miss of about 11 to 12 beats (10.8 to 12.4) in healthy Norwegians, in the US FRIEND registry, in HERITAGE’s sedentary Black and white adults and in 5,437 women [7] [10] [11] [8]; limits of agreement of about 18 to 25 beats either side in three US studies, two of them from one lab [10] [3] [15]; similar errors in 4,043 runners [14] and in older adults at heart risk [17]; and most of the age formulas collected in the 2002 history miss by more than 10 beats [12]. Different countries, decades, machines and people. This is a measurement question, and it has been answered by measuring.
Rated alone, in words. 220 minus age is your maximum heart rate, as a statement about you, is Unsupported, of the tested kind: tested in every study above, and it did not hold for individuals. Tanaka’s formula is better is Supported for the average in healthy adults from about 40 on, especially past 60, where 220 minus age reads lowest (in Norway healthy older adults sat higher than both lines, and in older adults at heart risk every formula read high [7] [17]); under 40 the studies on this page split, Tanaka’s line closer on average in the Virginia lab’s adults under 40 and 220 minus age closer in the Polish runners, average age 34 [3] [14]; and Unsupported, of the tested kind, as a way to pin down your own maximum: it narrows the miss by about a beat. The Nes formula is better is Unsupported, of the tested kind: it fits the Norwegians it was built from, which is not a test of it, and in the three samples outside Norway on this page, two from the Virginia lab and the Polish runners, it read high on average, by about 4 to 6 beats, and was never more accurate than Tanaka’s [3] [15] [14]. Women need their own formula is Unsupported, of the tested kind: one large study, on a test with no breathing-gas check of maximal effort, found women’s peak heart rate lower; four studies that confirmed a maximal effort found that knowing a person’s sex did not improve the prediction, HERITAGE’s women sat within a beat of Tanaka’s line for both sexes, and the women’s formula itself read about 8 beats low when one lab tried it on 32 women [8] [2] [10] [7] [3] [11] [15]. Fitness raises your maximum heart rate is Unsupported, of the tested kind, for adults of the same age; that fitter people lose it more slowly with age is Preliminary: one cohort found it, and two other studies, the 2001 pooling and HUNT, found no such difference [23] [2] [7].
What is not rated here: whether training by heart-rate zones beats training by feel, which our zone 2 verdict covers for that zone; the watch maker’s ten-beat rule; resting heart rate; and the frame above, which is this desk’s reasoning from the evidence rather than a result the evidence delivered. It is marked as ours so that you can weigh it as ours.
This is journalism, not medical advice. If you have a heart condition or take heart medicines, your maximum and your training zones are questions for your clinician. How we read a study, and what each tier means, is set out here.
- Is Running Bad for Your Knees? For Recreational Runners, No. That It Protects Them Is Less Certain.
unsupported - How to Raise HDL: Exercise Lifts It About 2 mg/dL. Two Pills Approved Partly to Raise It Lost Approval After Heart Trials Found No Clear Benefit.
supported - White Coat Hypertension: In Four Studies, High Blood Pressure or Pills for It Followed Roughly Twice as Often. The Death Risk Is Unsettled.
supported