Does Running Burn Fat? Yes — But Not in the “Fat Burning Zone”

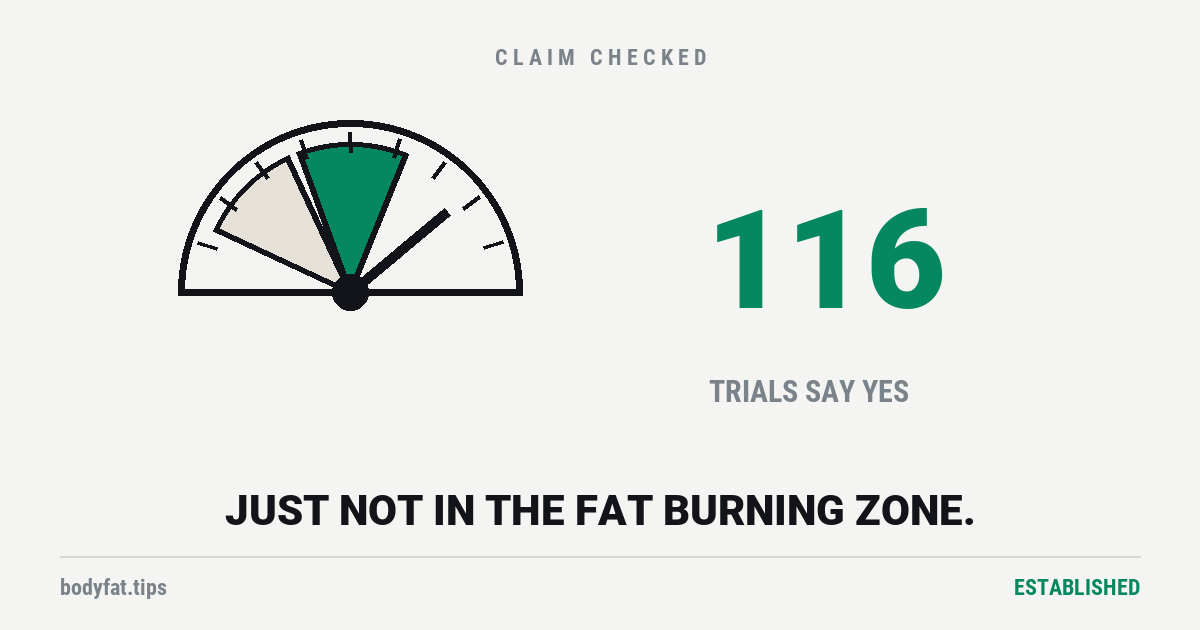
Yes. This one is settled, and we should say so before anything else: pool 116 controlled trials covering 6,880 adults with overweight or obesity and the standard recommended dose of aerobic exercise — about 150 minutes a week — produces around 6.2 lb (2.8 kg) of weight loss and a 2 percentage point drop in body fat [1]. Double the exercise and weight loss rises to about 9.2 lb (4.2 kg) — half again, not double, and the range of plausible answers around that second number is wide — while the body-fat-percentage figure did not keep climbing past 150 minutes [1].
So jogging works. What doesn’t work is the sticker on the treadmill telling you how to do it.
The zone on the machine
Nearly every cardio machine and fitness watch marks a band, usually around 60 to 70 percent of your maximum heart rate, and labels it the fat burning zone. The implication is plain: go slower, burn more fat.
The physiology underneath that label is real. At lower intensities your body does take a larger share of its fuel from fat, and there genuinely is an intensity at which fat is burned fastest — researchers call it FATmax and it has been measured carefully for over twenty years [5].
Both of those facts are true. The conclusion drawn from them is not.
Where the reasoning breaks
A percentage is not a total. Going slower means fat makes up more of the fuel you burn — while you burn less fuel. The relevant question is not which fraction came from fat during the workout; it is how much fat is gone at the end of the month.
And on that, the body keeps its own books.
Researchers put sixteen people in a sealed metabolic chamber for a full day at a time, three separate times: once resting, once burning 400 calories at low intensity, once burning the same 400 calories at high intensity. Over the 24 hours, the amount of fat burned did not differ between any of the three conditions [3]. A second study in obese men found the same: the fuel difference visible during exercise was compensated for afterwards, leaving the daily totals the same [4].
The readout on the machine is a snapshot of a forty-five minute window inside a twenty-four hour ledger that balances itself.
The trial that tested it properly
The cleanest test ran for eight months with 182 sedentary adults, diets held steady. Two of the groups burned exactly the same number of calories per week — one at moderate intensity, one at vigorous. If intensity mattered, this is where it would show.
It didn’t. The researchers reported no measure on which the vigorous group did significantly better. What did matter was amount: the group that exercised nearly twice as much lost roughly twice the fat [2].
Same calories, different speed, same result. More calories, better result. That is the entire finding.
The number nobody prints
It is worth seeing how small the fat-burning rate is even when everything is optimal. In the largest set of measurements available, an overweight woman exercising at her own perfect fat-burning intensity oxidises about 0.16 grams of fat a minute [7]. That is under 10 grams an hour.
A pound of body fat is roughly 395 grams of actual lipid. So at the mathematically ideal fat-burning intensity, you would need something on the order of forty hours of exercise to oxidise a pound’s worth — and that is before the compensation above erases part of it. (That last calculation is ours, from their measured figure.)
And the zone is in the wrong place anyway
Here is the part that should embarrass the industry.
The machines mark roughly 60 to 70 percent of maximum heart rate. But when researchers actually measured where fat oxidation peaks, they found it at around 74 percent of maximum heart rate [5]. A separate study in trained runners put the fat-burning band at 67.6 to 87.1 percent — higher than the standard aerobic zone, and overlapping it heavily [6].
So even granting the myth its own logic, the band printed on the equipment is set too low. And the same measurements show the zone varies enormously between individuals — wide enough that a single printed range cannot describe a room full of people [7].
The runner study’s own conclusion was that the zones overlap so much that training for fat burning and training for fitness are not opposing choices [6]. The trade-off the label implies does not exist.
Why the results are smaller than the calorie maths predicts
If you have ever done the arithmetic on calories burned and wondered why the scale disagreed, this is the answer, and it is not a character flaw.
Across 1,754 adults measured with the gold-standard method, people compensate for roughly 28 percent of the energy they burn through activity — the body quietly economises elsewhere. Among those with the most body fat, compensation reached about 46 percent [8].
Behaviour does the rest. In a supervised twelve-week trial, average loss was 3.7 kg — but individuals ranged from losing 14.7 kg to gaining 1.7 kg. The people who lost least had increased their food intake by around 268 calories a day and reported feeling hungrier [9].
Exercise makes some people hungry. That is physiology, not weakness — but it is why the arithmetic overpromises.
The honest counter-argument
Three things cut against a tidy debunk, and they belong here.
One small trial in severely obese adolescents did find greater fat loss with lower-intensity training [12]. It ran three weeks, with 20 teenagers split between the two intensities, alongside calorie restriction — and we could not confirm from the published abstract whether the groups burned matched calories, which is the thing that would make it a real test. Worth knowing about, not enough to move the verdict.
Second: training at your fat-max intensity genuinely does produce fat loss [10]. But read the comparisons — six of the eleven trials measured it against not exercising, three against a low-calorie diet, and only two against another kind of training. None of them reported the calories burned, a gap the authors list among their limitations, so even those two cannot say whether speed or amount made the difference; and the pooled figure is each group’s change from its own starting point, not a head-to-head margin. It shows exercise beats sitting down. It says nothing about which speed is better.
Third: the Cochrane review this page leans on for the health benefits also found that harder exercise took off more weight — 3.3 lb (1.5 kg) more, pooled from four trials of 317 people who were not dieting [11]. Doesn’t that put intensity back in play? Not the way the zone label means it. By the review’s own description, the trials it grouped as high versus low intensity were not calorie-matched tests of speed: walking at two paces sits in the pool next to adding weight training, or swapping a step class for “move more during the day”, with sessions of 20 to 60 minutes against 10 to 60. More intensity there meant more work done, which is the STRRIDE result again — the amount moved the scale, and the zone did not.
What to actually do
Jog. The evidence for aerobic exercise is solid, and it improves blood pressure, triglycerides and blood sugar whether or not the scale moves [11].
Then ignore the zone and optimise the two things that actually showed up in the trials: total amount, and whether you will keep doing it. The best intensity is largely the one you will still be doing in six months. Past a year the evidence thins out: the 116-trial review found only two reports of exercise running longer than 48 weeks, both from one 16-month trial, and both showed small effects [1].
Nobody sells a heart-rate feature for that, which is roughly why you haven’t been told it.
Four descriptions of the evidence were corrected on 15 September 2026 after an independent editorial review. The lead paragraph said that doubling the exercise roughly doubles the weight loss; the 116-trial meta-analysis it cites puts the figure at 6.2 lb (2.79 kg) at 150 minutes a week and 9.2 lb (4.19 kg) at 300 — half again, not double — and reports that the drop in body-fat percentage was greatest at 150 minutes and did not keep growing. The same sentence said the loss came “without changing what people ate” and cited that meta-analysis, whose authors say the trials gave them too little dietary data to account for; the clause is gone, and the diet point now rests where it belongs, on the eight-month STRRIDE trial, which measured intake and found no change. “A pair of small trials” in obese adolescents was one trial of 20, and the group sizes we gave were not in its abstract. And the participants were described as 6,880 people; they were adults with overweight or obesity, and the page and its evidence panel now say so.
Also changed: the evidence panel’s longest follow-up read 8 months (STRRIDE) when the meta-analysis includes a 16-month trial, and the page now notes that only two reports in that review ran past 48 weeks; the counter-argument section gains the Cochrane finding that harder exercise lost 3.3 lb (1.5 kg) more, with why that is not a calorie-matched test; the description of the fat-max trials’ comparisons now matches the review; the zones-overlap conclusion is credited to the runner study; DOIs were added for two sources; and the provenance chain’s research step is dated 2002, the year of the paper it names. This page was rebuilt on 25 July 2026 on the December 2024 meta-analysis; the June 2024 date at the top is the original post’s. The rating is unchanged.
- Can You Burn Fat Off One Specific Body Part?
unsupported - Does Calisthenics Build Muscle? The Light-Load Leg Grew 6.8%, the Heavy-Load Leg 7.2%. Muscle Can’t Tell What It’s Lifting, Only How Close to Failure You Got.
supported - Does Dancing Help You Lose Weight? A Zumba Class Burned 369 Calories, Not 1,000. Eight Pooled Trials Couldn’t Find the Fat Loss.
preliminary