How to Improve VO2 Max: Training Raises It. Your Watch Is a Rough Guide.

Here is the whole thing in two numbers.
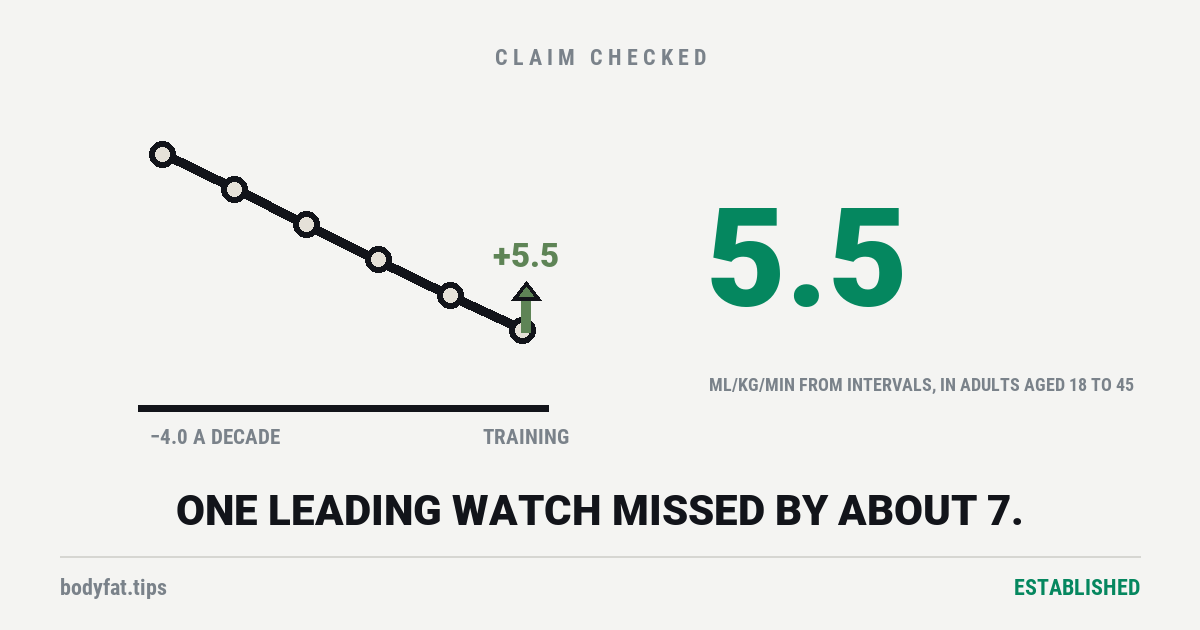
In the US reference data, each decade of age sits about 4.0 lower than the one before it, from the twenties on; that compares different people, each tested once, not anyone measured as they aged. In trials of adults aged 18 to 45, a few months of interval training added about 5.5. [4][2]
Same units. So, on our own arithmetic, a decent training block is worth about a decade of that age gap, at least for the young adults those trials studied — and that is the honest, boring, extremely good news at the centre of a topic that has otherwise been turned into a longevity sales pitch.
The catch is that the number on your wrist is only a rough guide. In two independent laboratory checks, a leading smartwatch missed the measured value by about 7 mL/kg/min on average, more than the gain you are trying to see [11][12]. Whether it can show your own gain over time is a separate question, and further down we say what we could find on it.
First, what the number actually is
VO2 max is the most oxygen your body can take in and use in one minute, per kilogram you weigh, when you are working as hard as you can possibly go. That is it. It is measured in millilitres of oxygen per kilogram of bodyweight per minute — written mL/kg/min — and there is no everyday American unit for it, so it stays as the researchers write it.
A proper measurement involves a mask, a treadmill or a bike, and somebody increasing the difficulty until you cannot continue. Everything else is an estimate.
So what is a good one?
That question has its own page, because the answer is a table rather than a sentence: VO2 max by age, and the three things that move your percentile before you train. It carries the American reference standard — 22,379 measured tests — for men and women by decade. [4]
The one number worth carrying into the rest of this page is the slope. Across six decades the average treadmill score falls by 13.5%, or 4.0 mL/kg/min, per decade; at the 50th percentile, the ordinary middle, the fall averages about 4.2 (our arithmetic from the paper’s tables). [4] Those are different people in each age group, each tested once, so the slope shows how the age groups compare, not how fast any one person declines; the people tested were referred for different reasons, and the authors note that some had diabetes or obesity. [4] It is still the yardstick everything below is measured against.
Why anybody cares: the mortality number, and how it gets abused
This is the part that built the industry, and it is genuinely one of the largest associations in the field.
A 2024 overview in the British Journal of Sports Medicine pooled 26 systematic reviews covering 199 unique cohort studies and over 20.9 million observations. Those totals cover every outcome the 26 reviews studied; for death, eight reviews pooled 95 cohorts. Comparing people with high fitness to people with low fitness, the reviews it collected put the hazard ratio for dying of any cause at 0.47 to 0.59 — which in plain terms means the high-fitness group had roughly half to three-fifths of the risk over the follow-up period. The 0.47 comes from one meta-analysis of 19 cohorts and about 2.2 million people; its range of plausible values ran from 0.39 to 0.56, so “no effect” is nowhere near it. [1]
They also report a dose-response: each 1-MET step up in fitness went with an 11% to 17% lower risk of dying. A MET is just a repackaging of the same unit — one MET is 3.5 mL/kg/min. [1]
Now the sentence the sales pitches leave out. The authors’ own certainty rating for this evidence ranges from very low to moderate. [1] Not high. They started this evidence at high certainty, because a decades-long trial of fitness is not feasible, and marked it down mainly because most of the studies included only men: for dying of any cause, the reviews held about 1.86 million men and 180,000 women. So the case is strongest for men, and thinner for women than its size suggests. Every one of those cohorts compares people who are fitter with people who are not.
The comparison with smoking is older than that overview. A 2018 study of 122,007 patients sent for treadmill tests at one US academic medical centre put the least fit quarter’s risk of dying at five times that of the fittest 2.3%, and its authors called the risk that comes with low fitness “comparable to or greater than” smoking or diabetes [20]. The news coverage that followed said not exercising was worse for your health than smoking. Set the two middle quarters side by side instead, just below and just above average, and the less fit carried 41% more risk of dying, the same as smoking’s 41% [20]. And the study measured one treadmill test per patient, not how much anyone exercised.
The multiplication that does not work
Here is the move.
Take the 11-to-17%-per-MET figure. Take your own training gain of 5 mL/kg/min, call it about 1.4 METs. Multiply. Announce that you have bought yourself some specific percentage of extra life.
That arithmetic is not licensed by the study it borrows from. The cohorts show that fitter people die later. They do not show that moving yourself from one group to the other transfers the whole association with you — because the people who are fit at 50 have usually been fit for decades, and being the kind of person whose fitness is high is bundled with a great many other things.
This is the same trap as the sauna research, where a striking Finnish number came out of 201 men and ten deaths, and randomised trials of regular heat found much less, though most of them tested infrared saunas or hot water rather than a Finnish sauna, and mostly in people who were already ill. A huge observational finding tells you the association is real. It does not tell you it will move when you push on it.
Does training actually raise it? Yes, and this part is settled
This is where the evidence gets much better, because you can randomise somebody into a training programme, and people have, repeatedly.
A 2015 meta-analysis pooled 28 controlled trials, 723 people, healthy adults aged 18 to 45 (their average age was 25). Not every trial had a group that did no exercise: 10 compared endurance training with one and 13 compared intervals with one. Against those no-exercise groups, the review estimated: [2]
| What | Change | Where it comes from |
| Next decade’s age group | −4.0 | 22,379 treadmill and cycle tests, 34 US labs |
| Endurance training | +4.9 | 10 of the 2015 review’s 28 trials |
| Interval training | +5.5 | 13 of the same 28 trials |
| How far one leading smartwatch missed, on average | 6.8–6.9 | two studies, 28 and 35 people, against a gas analyser |
Endurance training added about 4.9 mL/kg/min. Interval training added about 5.5. Head to head, intervals beat steady work by about 1.2, an edge the review itself rated “possibly small”. [2] A 2026 review of 115 randomised trials, in people from children to older adults and from the sedentary to elite athletes, put it at about 1.3 [17]. Real, replicated, and considerably smaller than the internet’s enthusiasm for intervals would suggest.
Those gains come from young adults, and 5.5 is the top of the range. Across 24 reviews of interval training, the gains against no exercise ran from 3.25 to 5.5 where they were reported in these units [18]. In people aged 65 and over, a 2020 review of 15 randomised trials found about 1.35 from steady endurance training and about 4.6 from intervals [19].
And trials whose volunteers started less fit tended to report bigger gains, clearly so for intervals and less certainly for steady training, where “no extra gain” was still inside the plausible range. [2] That compares groups across trials. Inside one large training study, HERITAGE (below), how fit people were at the start did not predict how much they gained [6]. Either way, starting unfit is no barrier to improving, which is the opposite of how almost everything in fitness is sold.
What the training actually looked like
A 2019 meta-analysis of 53 randomised trials sorted the interval protocols by length, volume and duration to see which shape of session did most. [3]
Two findings, and they point in different directions. Even the minimal version works against doing nothing — short intervals (30 seconds or less), small volumes (5 minutes or less of hard work in a session) and short programmes (4 weeks or less) each still produced clear gains; those were three separate comparisons, not one tested recipe. [3]
But to actually maximise the number, the review’s subgroups that did best had intervals of 2 minutes or longer, 15 minutes or more of hard work in a session, and programmes running 4 to 12 weeks or longer — again three separate comparisons. Against ordinary moderate continuous training, only those longer, higher-volume and longer-running programmes came out ahead in that review. [3] A 2026 review of 115 randomised trials, searched six years later, found short intervals and long intervals ahead of continuous training by about the same margin [17].
These are reported as standardised mean differences, which need a scale to mean anything: roughly, 0.2 is a small effect, 0.5 moderate, 0.8 and above is what researchers call large. The maximising protocols ran from 0.50 to 2.48. [3]
So the four-minute miracle workout is not a lie. It is just the floor being sold as the ceiling.
Does raising it actually help you, though?
Several cohorts have tested the same people twice and then counted deaths. The largest we cite followed 93,060 US veterans, 95% of them men and about half with a history of cardiovascular disease (heart attacks, heart failure and strokes among them), each given two treadmill tests about six years apart: changes in fitness of one MET or more went with matching changes in the risk of dying, in both directions [8]. Fitness there was worked out from treadmill speed, slope and time, not measured with a mask. A 2019 study is one of the few to measure oxygen directly both times: 833 adults who each had two proper laboratory tests, an average of 8.6 years apart, then followed for an average of 17.7 years. [5]
Each 1 mL/kg/min of improvement between the two tests went with roughly 11% lower all-cause mortality. That held in men; in the 281 women, 40 of whom died, it could no longer be told apart from chance once the authors also allowed for changes in blood pressure, cholesterol, blood sugar, weight, activity and smoking. And the later test predicted death better than the earlier one — meaning where you are now matters more than where you started. [5]
The same research group also followed 683 adults who had a laboratory test before and after an exercise programme, for about 30 years on average after the second test, and reported 20% lower risk of dying per MET of improvement in men and 38% in women [9]. All of that is still short of proof. It is observational: nobody was assigned to improve, and people whose fitness went up over the years were also doing other things. We wrote down how we grade this kind of evidence.
A randomised trial was built to test it. Generation 100, in Norway, assigned 1,567 people aged 70 to 77, most of them in good health, to five years of supervised interval training, steady training or the national activity advice, and counted deaths. Deaths did not differ between the people who trained and the controls. The interval group’s hazard ratio against the controls was 0.63: about a third fewer deaths, with a plausible range from two-thirds fewer to a fifth more, so “no effect” is still on the table. And the controls, left to follow the guidelines, ended up doing more hard exercise than the steady-training group [10].
The caveat nobody selling you a programme will mention
In the HERITAGE Family Study, 481 sedentary adults from 98 families did the same supervised 20-week training programme. Same sessions. Same supervision. [6]
The average gain was about 400 mL/min. But in the researchers’ own words there was “considerable heterogeneity in responsiveness, with some individuals experiencing little or no gain, whereas others gained >1.0 l/min”. [6]
Some people did the whole programme properly and barely moved. Others gained more than twice the average. And the response clustered in families: the study put the “maximal heritability” of the response, its upper estimate of how much of the variation between people runs in families, at around 47%. That ceiling counts genes and the home life a family shares together, and it describes the spread between people in those 481 volunteers, all of them white, not how much of any one person’s response was fixed. [6]
So some of the difference between people runs in families, but that cannot tell you how much of your own response was set before you started. And two later analyses that compared trained volunteers with untrained control groups, one pooling 1,879 people from eight randomised trials and one pooling 24 studies, found that most of the apparent spread in gains is measurement error (one adds what people did outside the sessions); neither found strong evidence that people truly differ in how trainable they are [15][16]. If you have trained honestly and your number has not moved much, that is a documented outcome, not a character flaw. It is also the reason to judge a programme by whether you can keep doing it rather than by somebody else’s results.
And now the watch
Almost nobody reading this has had a mask on their face. The number you have is an estimate produced by a wrist device from your heart rate and your pace.
One leading smartwatch was checked against a laboratory gas analyser in a 2024 study. The watch read 41.37 where the laboratory measured 45.88. The reliability statistic — how closely the two agreed from one person to the next — came out at 0.47, which the authors classify as poor, though they judged the overall agreement, measured another way, to be good. Its average miss was 15.79% of the laboratory value (the mean absolute percentage error), and its root-mean-square error, a measure of the miss that weighs big misses more heavily, was 8.85 mL/kg/min. Those are two different statistics, not one figure in two units. [7]
Look at that last number against the top of this page. A training block gains a young adult about 5. Two larger independent studies since, of 28 and 35 people, found later models of the same watch read about 6 mL/kg/min low on average and missed by about 7 either way: a mean absolute error, the average size of the miss in whichever direction it went, of 6.92 and 6.79 [11][12]. So a single reading can be off by more than the gain you are chasing. That compares one reading with the laboratory; it says nothing yet about whether the watch can show your change.
The 2024 study ran nineteen people, and that matters. [7] Nineteen is small, the watch’s estimate came after a single outdoor session, and the study’s own authors say their figures cannot contradict the maker’s accuracy claim. The maker’s own study, as that paper describes it, followed people over more than a year of wear against a mix of maximal and submaximal tests and reported an average difference of about 1.2 to 1.4, an average in which misses in both directions partly cancel [7]; the maker’s own white paper shows the comparison was with a value projected from the submaximal part of those tests to an age-predicted maximum heart rate, not a measured maximum [21]. The two later independent studies, in one of which the watch had been worn for five to ten days first, found an average difference of about 6, in the low direction [11][12].
There is also a fair defence of your watch that is worth stating, because leaving it out would be the same overclaiming this page is about. A device can be wrong in a consistent direction and still be useful for tracking change, because a steady offset cancels out when you compare yourself to yourself. All three studies measured accuracy against the laboratory at a single point; none tested whether the watch tracks improvement over time. For the watch tested here, in healthy adults, we found no independent study that has tested whether it tracks a training gain (searched 1 and 9 October 2026). The nearest studies point both ways. An older heart-rate watch failed to track an eight-week training gain in 20 college soccer players: its readings rose, but how much they rose had almost nothing to do with how much each player’s laboratory value rose [13]. In 20 runners training for a half-marathon over twelve weeks, another maker’s watch read high both times, and both averages rose by about 1 mL/kg/min (our arithmetic from the published averages); the published summary does not say whether each runner’s change matched [22]. The largest of these in healthy people, reported so far only as a conference abstract, followed 47 active-duty US Air Force personnel through 12 weeks of training: the laboratory measured an average gain of about 3.2 mL/kg/min, and neither of two other makers’ watches registered it, their average estimates moving by −0.13 and +0.19, even among the people whose laboratory value rose by 8% or more [23]. In 48 adults with complex congenital heart disease, most of them wearing the brand tested here, changes on the watch followed changes in the laboratory closely over a year or more [14]. None of the four tested the watch on this page in healthy people who are training.
What you should not do is treat the precise-looking number on the screen as a measurement of your body, or compare it with somebody else’s watch.
What this all adds up to
Fitness is a marker you can move, and that is not the same as a lever on your lifespan. VO2 max predicts a great deal, and training raises it; that part is settled. Grip strength predicts a great deal too, and we found no trial of grip training that set out to measure deaths or heart attacks. For fitness, the five-year Norwegian trial above did count deaths, in mostly healthy 70-somethings, and found no clear difference overall. Being able to push a number up is not the same as knowing that pushing it buys the years the cohorts predict, and the two get discussed as though they were the same.
The practical version, with nothing added that the studies did not say:
— The gain from training is roughly 5 mL/kg/min in trials of young adults, about the gap between one age group and the next in the US reference data. [2][4] Older adults gain less from steady training. [19]
— Intervals beat steady work, by about 1.2. Both work. The gap is smaller than the argument about it. [2]
— Against steady training, a 2019 review favoured longer intervals and more of them — 2 minutes and up, 15 minutes of work and up, in programmes of 4 to 12 weeks or longer [3]; a 2026 review of 115 trials found short and long intervals about equally ahead. [17]
— Starting unfit is no barrier. Trials of less-fit groups tended to report bigger gains [2]; inside one large study, starting fitness did not predict the gain [6].
— Some people gain very little on an identical programme. Up to about half of that spread traced to family in one study [6], and later analyses put most of it down to measurement error [15][16].
None of that requires a subscription, a test, or a wearable. It requires being out of breath on purpose, regularly. Running, walking enough of them and lifting all have their own pages here.
And the thing being sold is mostly the measurement, not the fitness. The testing, the wearable, the dashboard, the score you can post. The part that actually moves the number has been free and well-evidenced for forty years, and it is the part with no margin in it.
Corrected on 18 September 2026. This page described the randomised trials behind our sauna verdict as trials “that followed” the Finnish finding, which read as a direct test of it. The sauna verdict, corrected today after an independent editorial review, now reports that only three of the 20 used a Finnish sauna and most were in people with heart failure or another condition. Many of them, too, were run before the Finnish paper appeared, not after it. The sentence now says what they tested. The point it makes, and the rating, are unchanged.
Corrected on 30 September 2026. The closing section said squeezing a gripper “does not fix” what grip strength predicts. That read as a finding, and it is not one: nobody has tested it, as our grip strength verdict, corrected today after an independent editorial review, now says. The sentence here says the same.
Corrected again on 30 September 2026. Our earlier note today said nobody has tested whether squeezing a gripper fixes what grip strength predicts. That was broader than the search behind it. What our grip strength verdict, corrected a second time today, can support is narrower: we found no trial of grip training that counted deaths or heart attacks (searched 30 September 2026). The sentence now says that. The rating is unchanged.
Corrected on 9 October 2026 after an independent editorial review. The headline said your watch cannot see a training gain. That rested on one 19-person study of how closely single readings agreed with the laboratory, a study that never tested whether the watch tracks change, and we printed its two error statistics (an average miss of 15.79% and a root-mean-square error of 8.85 mL/kg/min) as one figure in two units. Two larger independent studies have since found the same maker’s watch missed by about 7 mL/kg/min on average. Whether it can follow your own gain is another question: in healthy adults we found no independent study that has tested it, and the nearest studies point both ways. The page also called one 833-person cohort the best available bridge between fitness gains and survival. Cohorts that tested people twice include one of 93,060 cited in our own first source, and a five-year randomised trial counted deaths after training and found no clear difference overall. Both are now on the page.
Also corrected: “roughly half of your trainability was decided before you were born” misread a family study’s upper estimate, which includes shared home life and describes differences between people, not one person; later analyses with untrained control groups put most of the apparent difference down to measurement error. The 4.0 per decade compares age groups of different people, not anyone ageing, and the 5.5 came from adults aged 18 to 45; older adults gain less. The 2024 overview’s authors marked their evidence down mainly because most of the people studied were men, not because it was observational, and its 0.47 is one of its reviews’ figures (they range from 0.47 to 0.59). The training figures came from 10 and 13 of the 2015 review’s 28 trials, whose programmes ran to at least 24 weeks, not 12. The 2019 review’s best protocols were three separate comparisons, and a 2026 review of 115 trials found short and long intervals about equally ahead of steady training. The funding row, which said no source stated its funding, now gives each source’s own statement. The headline is new; the rating, for “interval and endurance training raise VO2 max”, is unchanged.
Also corrected, from our own reading after that review. Our second note of 30 September said this page’s grip sentence had been narrowed; the sentence itself was not changed then, and is now. It also says less than that note did, because a 2026 trial of grip exercise in people with advanced kidney disease recorded a death, as our grip strength verdict, corrected on 7 October, explains. The 833-person cohort’s 17.7 years of follow-up is an average, not a maximum, and its link between improving and living longer held in men and was no longer clear in its 281 women once other risk factors were allowed for. The 4.0 a decade is the fall in the registry’s average score; at the 50th percentile, which the page named, it averages about 4.2. The two newer watch studies analysed 28 and 35 people, not the 30 and 40 they enrolled. The maker’s own accuracy figure was checked against a value projected from easier tests, not a measured maximum, as its white paper shows. A twelve-week study of another maker’s watch in runners, published on 1 October, now sits beside the two studies of change the page already had, and so does a 2024 conference abstract in which two other makers’ watches missed a 12-week training gain in 47 Air Force personnel. The page also called the 0.47 an agreement statistic; its authors call it a reliability statistic, and judged the overall agreement good. And the provenance chain, which described a process, now names where the comparison with smoking came from.